HSBC 2007 Annual Report Download - page 252
Download and view the complete annual report
Please find page 252 of the 2007 HSBC annual report below. You can navigate through the pages in the report by either clicking on the pages listed below, or by using the keyword search tool below to find specific information within the annual report.-
 1
1 -
2
-
3
-
4
-
5
-
6
-
7
-
8
-
9
-
10
-
11
-
12
-
13
-
14
-
15
-
16
-
17
-
18
-
19
-
20
-
21
-
22
-
23
-
24
-
25
-
26
-
27
-
28
-
29
-
30
-
31
-
32
-
33
-
34
-
35
-
36
-
37
-
38
-
39
-
40
-
41
-
42
-
43
-
44
-
45
-
46
-
47
-
48
-
49
-
50
-
51
-
52
-
53
-
54
-
55
-
56
-
57
-
58
-
59
-
60
-
61
-
62
-
63
-
64
-
65
-
66
-
67
-
68
-
69
-
70
-
71
-
72
-
73
-
74
-
75
-
76
-
77
-
78
-
79
-
80
-
81
-
82
-
83
-
84
-
85
-
86
-
87
-
88
-
89
-
90
-
91
-
92
-
93
-
94
-
95
-
96
-
97
-
98
-
99
-
100
-
101
-
102
-
103
-
104
-
105
-
106
-
107
-
108
-
109
-
110
-
111
-
112
-
113
-
114
-
115
-
116
-
117
-
118
-
119
-
120
-
121
-
122
-
123
-
124
-
125
-
126
-
127
-
128
-
129
-
130
-
131
-
132
-
133
-
134
-
135
-
136
-
137
-
138
-
139
-
140
-
141
-
142
-
143
-
144
-
145
-
146
-
147
-
148
-
149
-
150
-
151
-
152
-
153
-
154
-
155
-
156
-
157
-
158
-
159
-
160
-
161
-
162
-
163
-
164
-
165
-
166
-
167
-
168
-
169
-
170
-
171
-
172
-
173
-
174
-
175
-
176
-
177
-
178
-
179
-
180
-
181
-
182
-
183
-
184
-
185
-
186
-
187
-
188
-
189
-
190
-
191
-
192
-
193
-
194
-
195
-
196
-
197
-
198
-
199
-
200
-
201
-
202
-
203
-
204
-
205
-
206
-
207
-
208
-
209
-
210
-
211
-
212
-
213
-
214
-
215
-
216
-
217
-
218
-
219
-
220
-
221
-
222
-
223
-
224
-
225
-
226
-
227
-
228
-
229
-
230
-
231
-
232
-
233
-
234
-
235
-
236
-
237
-
238
-
239
-
240
-
241
-
 242
242 -
 243
243 -
 244
244 -
 245
245 -
 246
246 -
 247
247 -
 248
248 -
 249
249 -
 250
250 -
 251
251 -
 252
252 -
 253
253 -
 254
254 -
 255
255 -
 256
256 -
 257
257 -
 258
258 -
 259
259 -
 260
260 -
 261
261 -
 262
262 -
263
-
264
-
265
-
266
-
267
-
268
-
269
-
270
-
271
-
272
-
273
-
274
-
275
-
276
-
277
-
278
-
279
-
280
-
281
-
282
-
283
-
284
-
285
-
286
-
287
-
288
-
289
-
290
-
291
-
292
-
293
-
294
-
295
-
296
-
297
-
298
-
299
-
300
-
301
-
302
-
303
-
304
-
305
-
306
-
307
-
308
-
309
-
310
-
311
-
312
-
313
-
314
-
315
-
316
-
317
-
318
-
319
-
320
-
321
-
322
-
323
-
324
-
325
-
326
-
327
-
328
-
329
-
330
-
331
-
332
-
333
-
334
-
335
-
336
-
337
-
338
-
339
-
340
-
341
-
342
-
343
-
344
-
345
-
346
-
347
-
348
-
349
-
350
-
351
-
352
-
353
-
354
-
355
-
356
-
357
-
358
-
359
-
360
-
361
-
362
-
363
-
364
-
365
-
366
-
367
-
368
-
369
-
370
-
371
-
372
-
373
-
374
-
375
-
376
-
377
-
378
-
379
-
380
-
381
-
382
-
383
-
384
-
385
-
386
-
387
-
388
-
389
-
390
-
391
-
392
-
393
-
394
-
395
-
396
-
397
-
398
-
399
-
400
-
401
-
402
-
403
-
404
-
405
-
406
-
407
-
408
-
409
-
410
-
411
-
412
-
413
-
414
-
415
-
416
-
417
-
418
-
419
-
420
-
421
-
422
-
423
-
424
-
425
-
426
-
427
-
428
-
429
-
430
-
431
-
432
-
433
-
434
-
435
-
436
-
437
-
438
-
439
-
440
-
441
-
442
-
443
-
444
-
445
-
446
-
447
-
448
-
449
-
450
-
451
-
452
-
453
-
454
-
455
-
456
-
457
-
458
-
459
-
460
-
461
-
462
-
463
-
464
-
465
-
466
-
467
-
468
-
469
-
470
-
471
-
472
-
473
-
474
-
475
-
476
 |
 |

HSBC HOLDINGS PLC
Report of the Directors: The Management of Risk (continued)
Market risk > VAR / Trading portfolios
250
day. This may not fully reflect the market risk
arising at times of severe illiquidity, when a
one-day holding period may be insufficient to
liquidate or hedge all positions fully;
• the use of a 99 per cent confidence level, by
definition, does not take into account losses that
might occur beyond this level of confidence;
• VAR is calculated on the basis of exposures
outstanding at the close of business and
therefore does not necessarily reflect intra-day
exposures; and
• VAR is unlikely to reflect loss potential on
exposures that only arise under significant
market moves.
HSBC recognises these limitations by
augmenting its VAR limits with other position and
sensitivity limit structures. HSBC also applies a wide
range of stress testing, both on individual portfolios
and on the Group’s consolidated positions.
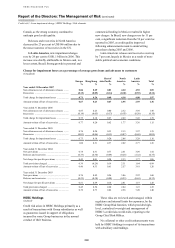
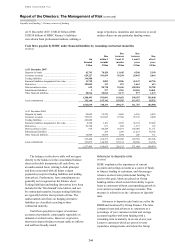
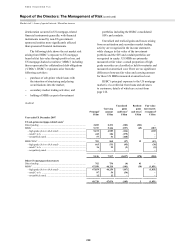
The VAR, both trading and non-trading, for the
Group was as follows:
Value at risk
(Audited)
2007 20061
US$m US$m
At 31 December ....................... 95.3 68.9
Average .................................... 78.4 74.5
Minimum ................................. 55.6 41.5
Maximum ................................. 107.0 128.8
1 Restated to incorporate the VAR for HSBC Finance and
mortgage servicing rights that were previously reported
separately.
Total VAR at 31 December 2007 increased,
compared with 31 December 2006. The major cause
of this was an increase in volatility in market rates
during the latter half of 2007.
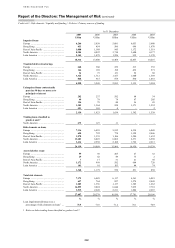
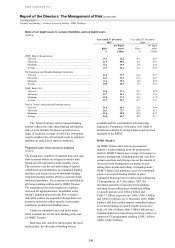
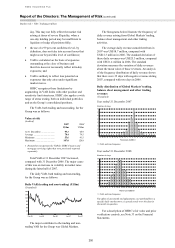
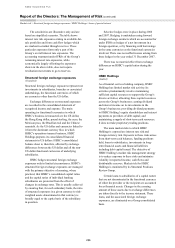
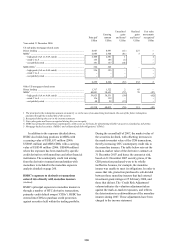
The daily VAR, both trading and non-trading,
for the Group was as follows:
Daily VAR (trading and non-trading) (US$m)
(Unaudited)
0
20
40
60
80
100
120
140
Dec-05 Jun-06 Dec-06 Jun-07 Dec-07
The major contributor to the trading and non-
trading VAR for the Group was Global Markets.
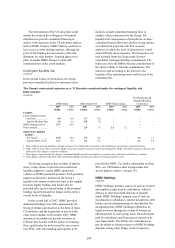
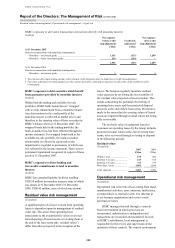
The histograms below illustrate the frequency of
daily revenue arising from Global Markets’ trading,
balance sheet management and other trading
activities.
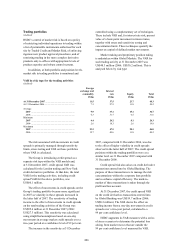
The average daily revenue earned therefrom in
2007 was US$18.7 million, compared with
US$21.3 million in 2006. The standard deviation of
these daily revenues was US$25.3 million, compared
with US$11.4 million in 2006. The standard
deviation measures the variation of daily revenues
about the mean value of those revenues. An analysis
of the frequency distribution of daily revenue shows
that there were 35 days with negative revenue during
2007, compared with two days in 2006.
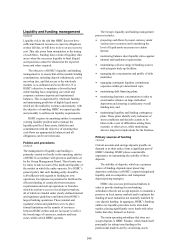
Daily distribution of Global Markets’ trading,
balance sheet management and other trading
revenues
(Unaudited)
Year ended 31 December 2007
Number of days
10 0 21 1 03 3
9
15
37
51
71
37
14
9
2021
0
10
20
30
40
50
60
70
80
-110 -100 -90 -80 -70 -60 -50 -40 -30 -20 -10 0 10 20 30 40 50 60 70 80 130 140 150
Revenues (US$m)
Profit and loss frequency
Year ended 31 December 2006
Number of days
01 1
7
16
20
37
46 45
27 26
10 10
2 2 2 22
00110
0
5
10
15
20
25
30
35
40
45
50
-12 -8 -4 0 4 8 12 16 20 24 28 32 36 40 44 48 52 56 60 64 68 72 76 80
Revenues (US$m)
Profit and loss frequency
The effect of any month-end adjustments, not attributable to a
specific daily market move, is spread evenly over the days in
the month in question.
For a description of HSBC’s fair value and price
verification controls, see Note 33 on the Financial
Statements.