HSBC 2007 Annual Report Download - page 149
Download and view the complete annual report
Please find page 149 of the 2007 HSBC annual report below. You can navigate through the pages in the report by either clicking on the pages listed below, or by using the keyword search tool below to find specific information within the annual report.-
 1
1 -
2
-
3
-
4
-
5
-
6
-
7
-
8
-
9
-
10
-
11
-
12
-
13
-
14
-
15
-
16
-
17
-
18
-
19
-
20
-
21
-
22
-
23
-
24
-
25
-
26
-
27
-
28
-
29
-
30
-
31
-
32
-
33
-
34
-
35
-
36
-
37
-
38
-
39
-
40
-
41
-
42
-
43
-
44
-
45
-
46
-
47
-
48
-
49
-
50
-
51
-
52
-
53
-
54
-
55
-
56
-
57
-
58
-
59
-
60
-
61
-
62
-
63
-
64
-
65
-
66
-
67
-
68
-
69
-
70
-
71
-
72
-
73
-
74
-
75
-
76
-
77
-
78
-
79
-
80
-
81
-
82
-
83
-
84
-
85
-
86
-
87
-
88
-
89
-
90
-
91
-
92
-
93
-
94
-
95
-
96
-
97
-
98
-
99
-
100
-
101
-
102
-
103
-
104
-
105
-
106
-
107
-
108
-
109
-
110
-
111
-
112
-
113
-
114
-
115
-
116
-
117
-
118
-
119
-
120
-
121
-
122
-
123
-
124
-
125
-
126
-
127
-
128
-
129
-
130
-
131
-
132
-
133
-
134
-
135
-
136
-
137
-
138
-
 139
139 -
 140
140 -
 141
141 -
 142
142 -
 143
143 -
 144
144 -
 145
145 -
 146
146 -
 147
147 -
 148
148 -
 149
149 -
 150
150 -
 151
151 -
 152
152 -
 153
153 -
 154
154 -
 155
155 -
 156
156 -
 157
157 -
 158
158 -
 159
159 -
160
-
161
-
162
-
163
-
164
-
165
-
166
-
167
-
168
-
169
-
170
-
171
-
172
-
173
-
174
-
175
-
176
-
177
-
178
-
179
-
180
-
181
-
182
-
183
-
184
-
185
-
186
-
187
-
188
-
189
-
190
-
191
-
192
-
193
-
194
-
195
-
196
-
197
-
198
-
199
-
200
-
201
-
202
-
203
-
204
-
205
-
206
-
207
-
208
-
209
-
210
-
211
-
212
-
213
-
214
-
215
-
216
-
217
-
218
-
219
-
220
-
221
-
222
-
223
-
224
-
225
-
226
-
227
-
228
-
229
-
230
-
231
-
232
-
233
-
234
-
235
-
236
-
237
-
238
-
239
-
240
-
241
-
242
-
243
-
244
-
245
-
246
-
247
-
248
-
249
-
250
-
251
-
252
-
253
-
254
-
255
-
256
-
257
-
258
-
259
-
260
-
261
-
262
-
263
-
264
-
265
-
266
-
267
-
268
-
269
-
270
-
271
-
272
-
273
-
274
-
275
-
276
-
277
-
278
-
279
-
280
-
281
-
282
-
283
-
284
-
285
-
286
-
287
-
288
-
289
-
290
-
291
-
292
-
293
-
294
-
295
-
296
-
297
-
298
-
299
-
300
-
301
-
302
-
303
-
304
-
305
-
306
-
307
-
308
-
309
-
310
-
311
-
312
-
313
-
314
-
315
-
316
-
317
-
318
-
319
-
320
-
321
-
322
-
323
-
324
-
325
-
326
-
327
-
328
-
329
-
330
-
331
-
332
-
333
-
334
-
335
-
336
-
337
-
338
-
339
-
340
-
341
-
342
-
343
-
344
-
345
-
346
-
347
-
348
-
349
-
350
-
351
-
352
-
353
-
354
-
355
-
356
-
357
-
358
-
359
-
360
-
361
-
362
-
363
-
364
-
365
-
366
-
367
-
368
-
369
-
370
-
371
-
372
-
373
-
374
-
375
-
376
-
377
-
378
-
379
-
380
-
381
-
382
-
383
-
384
-
385
-
386
-
387
-
388
-
389
-
390
-
391
-
392
-
393
-
394
-
395
-
396
-
397
-
398
-
399
-
400
-
401
-
402
-
403
-
404
-
405
-
406
-
407
-
408
-
409
-
410
-
411
-
412
-
413
-
414
-
415
-
416
-
417
-
418
-
419
-
420
-
421
-
422
-
423
-
424
-
425
-
426
-
427
-
428
-
429
-
430
-
431
-
432
-
433
-
434
-
435
-
436
-
437
-
438
-
439
-
440
-
441
-
442
-
443
-
444
-
445
-
446
-
447
-
448
-
449
-
450
-
451
-
452
-
453
-
454
-
455
-
456
-
457
-
458
-
459
-
460
-
461
-
462
-
463
-
464
-
465
-
466
-
467
-
468
-
469
-
470
-
471
-
472
-
473
-
474
-
475
-
476
 |
 |
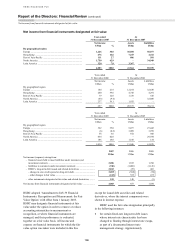
147
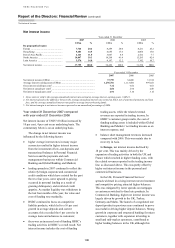
US$66 billion (2006: US$56 billion) of the
Group’s debt issues have been accounted for
using the fair value option. The movement in
fair value of these debt issues includes the
effect of own credit spread changes and any
ineffectiveness in the economic relationship
between the related swaps and own debt;
• as credit spreads narrow, accounting losses are
booked, and the reverse is true in the event of
spreads widening. Ineffectiveness arises from the
different credit characteristics of the swap and
own debt coupled with the sensitivity of the
floating leg of the swap to changes in short-term
interest rates. In addition, the economic
relationship between the swap and own debt can
be affected by relative movements in market
factors, such as bond and swap rates, and the
relative bond and swap rates at inception.
The size and direction of the accounting
consequences of changes in own credit spread
and ineffectiveness can be volatile from period
to period, but do not alter the cash flows
envisaged as part of the documented interest
rate management strategy;
• for certain financial assets held by insurance
operations and managed at fair value to meet
liabilities under insurance contracts, and certain
liabilities under investment contracts with
discretionary participation features (‘DPF’),
approximately US$17 billion of assets (2006:
US$6 billion); and
• for financial assets held by insurance operations
and managed at fair value to meet liabilities
under investment contracts, approximately
US$14 billion of assets (2006: US$12 billion).
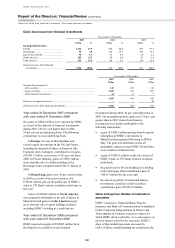
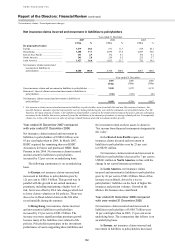
Net income from financial assets designated at
fair value which are held to support liabilities for
both insurance and investment contracts, is presented
as ‘Net income from financial instruments designated
at fair value’. For investment contracts, where the
liabilities to policyholders are designated at fair
value, the movement in the value of the liabilities is
presented in ‘Net income from financial instruments
designated at fair value’ in the income statement.
However, for insurance contracts, the movement in
liabilities arising from the net income allocated to
the policyholder is presented in ‘Net insurance
claims incurred and movement in liabilities to
policyholders’.
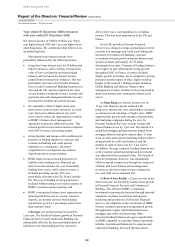
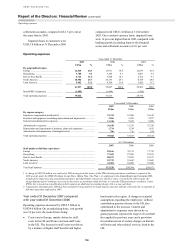
Year ended 31 December 2007 compared
with year ended 31 December 2006
Credit spreads widened significantly in the second
half of 2007, leading to a substantial increase in net
income from financial instruments designated at fair
value compared with 2006. This was primarily driven
by a widening in credit spreads on certain fixed-rate
long-term debt, issued by HSBC Holdings and its
subsidiaries. These cumulative gains will fully
reverse over the life of the debt. The cumulative
adjustment to reserves where the policy is applied for
the first time and, subsequently, the income statement
in terms of change in own credit spread since the fair
value option was available, is US$1.6 billion after
taking account of the US$3.1 billion credit in 2007.
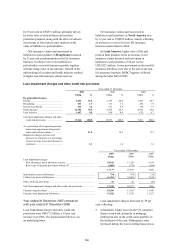
Income from assets held to meet liabilities under
insurance and investment contracts also rose by
32 per cent, mostly from premium growth and higher
investment returns on the portfolios held by the
insurance businesses in the UK and Hong Kong.
The change in fair value of liabilities under
investment contracts declined by 7 per cent.
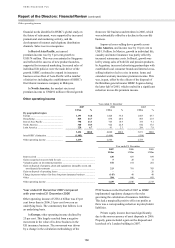
Year ended 31 December 2006 compared
with year ended 31 December 2005
Net income from financial instruments designated at
fair value decreased compared with 2005. This was
primarily driven by a narrowing (i.e. improvement)
in credit spreads on certain fixed-rate long-term debt
issued by HSBC Finance and lower net mark-to-
market movements on this debt and the related
interest rate swaps. During 2006, HSBC Finance’s
debt received improved ratings from both Moody’s
and S&P. Perversely, this improvement generated
accounting losses of some US$388 million which
will reverse over the residual maturity of the debt
instruments.
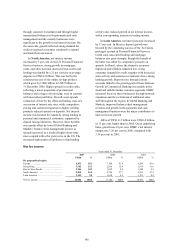
Income from assets held to meet liabilities under
insurance and investment contracts was some 12 per
cent lower, reflecting movements in the market
values of assets. The increase in the fair value of
liabilities under investment contracts was 10 per
cent lower than in 2005.