HSBC 2007 Annual Report Download - page 22
Download and view the complete annual report
Please find page 22 of the 2007 HSBC annual report below. You can navigate through the pages in the report by either clicking on the pages listed below, or by using the keyword search tool below to find specific information within the annual report.-
 1
1 -
2
-
3
-
4
-
5
-
6
-
7
-
8
-
9
-
10
-
11
-
 12
12 -
 13
13 -
 14
14 -
 15
15 -
 16
16 -
 17
17 -
 18
18 -
 19
19 -
 20
20 -
 21
21 -
 22
22 -
 23
23 -
 24
24 -
 25
25 -
 26
26 -
 27
27 -
 28
28 -
 29
29 -
 30
30 -
 31
31 -
 32
32 -
33
-
34
-
35
-
36
-
37
-
38
-
39
-
40
-
41
-
42
-
43
-
44
-
45
-
46
-
47
-
48
-
49
-
50
-
51
-
52
-
53
-
54
-
55
-
56
-
57
-
58
-
59
-
60
-
61
-
62
-
63
-
64
-
65
-
66
-
67
-
68
-
69
-
70
-
71
-
72
-
73
-
74
-
75
-
76
-
77
-
78
-
79
-
80
-
81
-
82
-
83
-
84
-
85
-
86
-
87
-
88
-
89
-
90
-
91
-
92
-
93
-
94
-
95
-
96
-
97
-
98
-
99
-
100
-
101
-
102
-
103
-
104
-
105
-
106
-
107
-
108
-
109
-
110
-
111
-
112
-
113
-
114
-
115
-
116
-
117
-
118
-
119
-
120
-
121
-
122
-
123
-
124
-
125
-
126
-
127
-
128
-
129
-
130
-
131
-
132
-
133
-
134
-
135
-
136
-
137
-
138
-
139
-
140
-
141
-
142
-
143
-
144
-
145
-
146
-
147
-
148
-
149
-
150
-
151
-
152
-
153
-
154
-
155
-
156
-
157
-
158
-
159
-
160
-
161
-
162
-
163
-
164
-
165
-
166
-
167
-
168
-
169
-
170
-
171
-
172
-
173
-
174
-
175
-
176
-
177
-
178
-
179
-
180
-
181
-
182
-
183
-
184
-
185
-
186
-
187
-
188
-
189
-
190
-
191
-
192
-
193
-
194
-
195
-
196
-
197
-
198
-
199
-
200
-
201
-
202
-
203
-
204
-
205
-
206
-
207
-
208
-
209
-
210
-
211
-
212
-
213
-
214
-
215
-
216
-
217
-
218
-
219
-
220
-
221
-
222
-
223
-
224
-
225
-
226
-
227
-
228
-
229
-
230
-
231
-
232
-
233
-
234
-
235
-
236
-
237
-
238
-
239
-
240
-
241
-
242
-
243
-
244
-
245
-
246
-
247
-
248
-
249
-
250
-
251
-
252
-
253
-
254
-
255
-
256
-
257
-
258
-
259
-
260
-
261
-
262
-
263
-
264
-
265
-
266
-
267
-
268
-
269
-
270
-
271
-
272
-
273
-
274
-
275
-
276
-
277
-
278
-
279
-
280
-
281
-
282
-
283
-
284
-
285
-
286
-
287
-
288
-
289
-
290
-
291
-
292
-
293
-
294
-
295
-
296
-
297
-
298
-
299
-
300
-
301
-
302
-
303
-
304
-
305
-
306
-
307
-
308
-
309
-
310
-
311
-
312
-
313
-
314
-
315
-
316
-
317
-
318
-
319
-
320
-
321
-
322
-
323
-
324
-
325
-
326
-
327
-
328
-
329
-
330
-
331
-
332
-
333
-
334
-
335
-
336
-
337
-
338
-
339
-
340
-
341
-
342
-
343
-
344
-
345
-
346
-
347
-
348
-
349
-
350
-
351
-
352
-
353
-
354
-
355
-
356
-
357
-
358
-
359
-
360
-
361
-
362
-
363
-
364
-
365
-
366
-
367
-
368
-
369
-
370
-
371
-
372
-
373
-
374
-
375
-
376
-
377
-
378
-
379
-
380
-
381
-
382
-
383
-
384
-
385
-
386
-
387
-
388
-
389
-
390
-
391
-
392
-
393
-
394
-
395
-
396
-
397
-
398
-
399
-
400
-
401
-
402
-
403
-
404
-
405
-
406
-
407
-
408
-
409
-
410
-
411
-
412
-
413
-
414
-
415
-
416
-
417
-
418
-
419
-
420
-
421
-
422
-
423
-
424
-
425
-
426
-
427
-
428
-
429
-
430
-
431
-
432
-
433
-
434
-
435
-
436
-
437
-
438
-
439
-
440
-
441
-
442
-
443
-
444
-
445
-
446
-
447
-
448
-
449
-
450
-
451
-
452
-
453
-
454
-
455
-
456
-
457
-
458
-
459
-
460
-
461
-
462
-
463
-
464
-
465
-
466
-
467
-
468
-
469
-
470
-
471
-
472
-
473
-
474
-
475
-
476
 |
 |

HSBC HOLDINGS PLC
Report of the Directors: Business Review (continued)
Business highlights
20
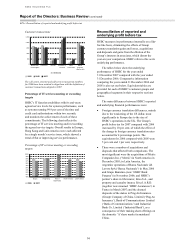
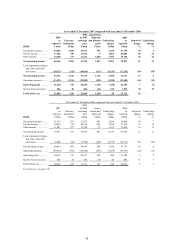
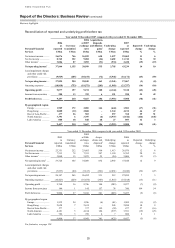
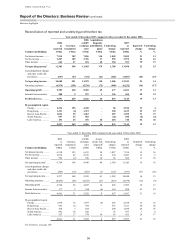
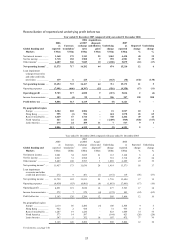
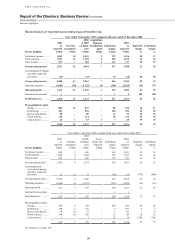
Reconciliation of reported and underlying profit before tax
Year ended 31 December 2007 compared with year ended 31 December 2006
Personal Financial
Services
2006
as
reported
US$m
Currency
translation1
US$m
2006
at 2007
exchange
rates
US$m
Acquisitions,
disposals
and dilution
gains2
US$m
Underlying
change
US$m
2007
as
reported
US$m
Reported
change
%
Underlying
change
%
Net interest income ......... 26,076 746 26,822 650 1,597 29,069 11 6
Net fee income ................ 8,762 322 9,084 (24) 2,682 11,742 34 30
Other income3 ................. 3,006 87 3,093 (91) (574) 2,428 (19) (19)
Net operating income4 .. 37,844 1,155 38,999 535 3,705 43,239 14 10
Loan impairment charges
and other credit risk
provisions ................... (9,949) (205) (10,154) (72) (5,946) (16,172) (63) (59)
Net operating income .... 27,895 950 28,845 463 (2,241) 27,067 (3) (8)
Operating expenses ......... (18,818) (753) (19,571) (283) (1,903) (21,757) (16) (10)
Operating profit ............ 9,077 197 9,274 180 (4,144) 5,310 (42) (45)
Income from associates .. 380 13 393 6 191 590 55 49
Profit before tax ............ 9,457 210 9,667 186 (3,953) 5,900 (38) (41)
By geographical region
Europe ......................... 1,909 172 2,081 144 (644) 1,581 (17) (31)
Hong Kong ................. 2,880 (12) 2,868 – 1,344 4,212 46 47
Rest of Asia-Pacific .... 477 26 503 – 257 760 59 51
North America ............ 3,391 6 3,397 (6) (4,937) (1,546) (146) (145)
Latin America ............. 800 18 818 48 27 893 12 3
9,457 210 9,667 186 (3,953) 5,900 (38) (41)
Year ended 31 December 2006 compared with year ended 31 December 2005
Personal Financial
Services
2005
as
reported
US$m
Currency
translation1
US$m
2005
at 2006
exchange
rates
US$m
Acqui-
sitions and
disposals2
US$m
Underlying
change
US$m
2006
as
reported
US$m
Reported
change
%
Underlying
change
%
Net interest income ......... 23,351 252 23,603 560 1,913 26,076 12 8
Net fee income ................ 7,313 78 7,391 247 1,124 8,762 20 15
Other income3 ................. 3,060 15 3,075 25 (94) 3,006 (2) (3)
Net operating income4 .... 33,724 345 34,069 832 2,943 37,844 12 9
Loan impairment charges
and other credit risk
provisions ................... (7,537) (80) (7,617) (301) (2,031) (9,949) (32) (27)
Net operating income ...... 26,187 265 26,452 531 912 27,895 7 3
Operating expenses ......... (16,427) (229) (16,656) (347) (1,815) (18,818) (15) (11)
Operating profit .............. 9,760 36 9,796 184 (903) 9,077 (7) (9)
Income from associates .. 144 1 145 157 78 380 164 54
Profit before tax .............. 9,904 37 9,941 341 (825) 9,457 (5) (8)
By geographical region
Europe ......................... 1,932 24 1,956 (6) (41) 1,909 (1) (2)
Hong Kong ................. 2,628 7 2,635 – 245 2,880 10 9
Rest of Asia-Pacific .... 377 – 377 159 (59) 477 27 (16)
North America ............ 4,181 3 4,184 184 (977) 3,391 (19) (23)
Latin America ............. 786 3 789 4 7 800 2 1
9,904 37 9,941 341 (825) 9,457 (5) (8)
For footnotes, see page 130.