HSBC 2007 Annual Report Download - page 190
Download and view the complete annual report
Please find page 190 of the 2007 HSBC annual report below. You can navigate through the pages in the report by either clicking on the pages listed below, or by using the keyword search tool below to find specific information within the annual report.-
 1
1 -
2
-
3
-
4
-
5
-
6
-
7
-
8
-
9
-
10
-
11
-
12
-
13
-
14
-
15
-
16
-
17
-
18
-
19
-
20
-
21
-
22
-
23
-
24
-
25
-
26
-
27
-
28
-
29
-
30
-
31
-
32
-
33
-
34
-
35
-
36
-
37
-
38
-
39
-
40
-
41
-
42
-
43
-
44
-
45
-
46
-
47
-
48
-
49
-
50
-
51
-
52
-
53
-
54
-
55
-
56
-
57
-
58
-
59
-
60
-
61
-
62
-
63
-
64
-
65
-
66
-
67
-
68
-
69
-
70
-
71
-
72
-
73
-
74
-
75
-
76
-
77
-
78
-
79
-
80
-
81
-
82
-
83
-
84
-
85
-
86
-
87
-
88
-
89
-
90
-
91
-
92
-
93
-
94
-
95
-
96
-
97
-
98
-
99
-
100
-
101
-
102
-
103
-
104
-
105
-
106
-
107
-
108
-
109
-
110
-
111
-
112
-
113
-
114
-
115
-
116
-
117
-
118
-
119
-
120
-
121
-
122
-
123
-
124
-
125
-
126
-
127
-
128
-
129
-
130
-
131
-
132
-
133
-
134
-
135
-
136
-
137
-
138
-
139
-
140
-
141
-
142
-
143
-
144
-
145
-
146
-
147
-
148
-
149
-
150
-
151
-
152
-
153
-
154
-
155
-
156
-
157
-
158
-
159
-
160
-
161
-
162
-
163
-
164
-
165
-
166
-
167
-
168
-
169
-
170
-
171
-
172
-
173
-
174
-
175
-
176
-
177
-
178
-
179
-
 180
180 -
 181
181 -
 182
182 -
 183
183 -
 184
184 -
 185
185 -
 186
186 -
 187
187 -
 188
188 -
 189
189 -
 190
190 -
 191
191 -
 192
192 -
 193
193 -
 194
194 -
 195
195 -
 196
196 -
 197
197 -
 198
198 -
 199
199 -
 200
200 -
201
-
202
-
203
-
204
-
205
-
206
-
207
-
208
-
209
-
210
-
211
-
212
-
213
-
214
-
215
-
216
-
217
-
218
-
219
-
220
-
221
-
222
-
223
-
224
-
225
-
226
-
227
-
228
-
229
-
230
-
231
-
232
-
233
-
234
-
235
-
236
-
237
-
238
-
239
-
240
-
241
-
242
-
243
-
244
-
245
-
246
-
247
-
248
-
249
-
250
-
251
-
252
-
253
-
254
-
255
-
256
-
257
-
258
-
259
-
260
-
261
-
262
-
263
-
264
-
265
-
266
-
267
-
268
-
269
-
270
-
271
-
272
-
273
-
274
-
275
-
276
-
277
-
278
-
279
-
280
-
281
-
282
-
283
-
284
-
285
-
286
-
287
-
288
-
289
-
290
-
291
-
292
-
293
-
294
-
295
-
296
-
297
-
298
-
299
-
300
-
301
-
302
-
303
-
304
-
305
-
306
-
307
-
308
-
309
-
310
-
311
-
312
-
313
-
314
-
315
-
316
-
317
-
318
-
319
-
320
-
321
-
322
-
323
-
324
-
325
-
326
-
327
-
328
-
329
-
330
-
331
-
332
-
333
-
334
-
335
-
336
-
337
-
338
-
339
-
340
-
341
-
342
-
343
-
344
-
345
-
346
-
347
-
348
-
349
-
350
-
351
-
352
-
353
-
354
-
355
-
356
-
357
-
358
-
359
-
360
-
361
-
362
-
363
-
364
-
365
-
366
-
367
-
368
-
369
-
370
-
371
-
372
-
373
-
374
-
375
-
376
-
377
-
378
-
379
-
380
-
381
-
382
-
383
-
384
-
385
-
386
-
387
-
388
-
389
-
390
-
391
-
392
-
393
-
394
-
395
-
396
-
397
-
398
-
399
-
400
-
401
-
402
-
403
-
404
-
405
-
406
-
407
-
408
-
409
-
410
-
411
-
412
-
413
-
414
-
415
-
416
-
417
-
418
-
419
-
420
-
421
-
422
-
423
-
424
-
425
-
426
-
427
-
428
-
429
-
430
-
431
-
432
-
433
-
434
-
435
-
436
-
437
-
438
-
439
-
440
-
441
-
442
-
443
-
444
-
445
-
446
-
447
-
448
-
449
-
450
-
451
-
452
-
453
-
454
-
455
-
456
-
457
-
458
-
459
-
460
-
461
-
462
-
463
-
464
-
465
-
466
-
467
-
468
-
469
-
470
-
471
-
472
-
473
-
474
-
475
-
476
 |
 |

HSBC HOLDINGS PLC
Report of the Directors: Financial Review (continued)
Other financial information > Off-balance sheet arrangements and SPEs
188
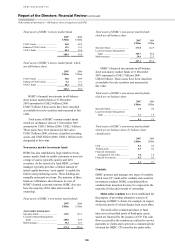
Total assets of HSBC’s money market funds
2007 2006
US$bn US$bn
CNAV funds .................................. 56.8 40.9
Enhanced VNAV funds ................. 11.9 15.2
VNAV funds .................................. 40.2 36.9
108.9 93.0
Total assets of HSBC’s money market funds, which
are off-balance sheet
2007 2006
US$bn US$bn
CNAV funds .................................. 56.8 40.9
Enhanced VNAV funds ................. 6.2 13.1
VNAV funds .................................. 40.2 36.9
103.2 90.9
HSBC’s financial investments in off-balance
sheet money market funds at 31 December
2007 amounted to US$2.9 billion (2006:
US$0.7 billion). These assets have been classified
as available-for-sale securities and measured at fair
value.
Total assets of HSBC’s money market funds
which are on-balance sheet at 31 December 2007
amounted to US$5.7 billion (2006: US$2.1 billion).
These assets have been measured at fair value;
US$0.7 billion (2006: nil) were classified as trading
assets, and US$5 billion (2006: US$2.1 billion) were
designated at fair value.
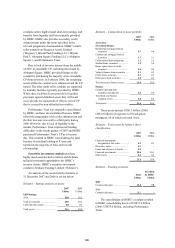
Non-money market investment funds
HSBC has also established a large number of non-
money market funds to enable customers to invest in
a range of assets, typically equities and debt
securities. At the launch of a fund HSBC, as fund
manager, typically provides a limited amount of
initial capital known as ‘seed capital’ to enable the
fund to start purchasing assets. These holdings are
normally redeemed over time. The majority of these
funds are off-balance sheet because in view of
HSBC’s limited economic interest, HSBC does not
have the majority of the risks and rewards of
ownership.
Total assets of HSBC’s non-money market funds
2007 2006
US$bn US$bn
Assets under management
Specialist funds .............................. 132.0 123.3
Local Investment Management
funds .......................................... 108.8 89.9
Multi-manager ............................... 30.4 22.3
271.2 235.5
Total assets of HSBC’s non-money market funds
which are off-balance sheet
2007 2006
US$bn US$bn
Specialist funds .............................. 131.0 122.9
Local Investment Management
funds .......................................... 105.7 88.0
Multi-manager ............................... 30.4 22.3
267.1 233.2
HSBC’s financial investments in off-balance
sheet non-money market funds at 31 December
2007 amounted to US$2.7 billion (2006:
US$2.0 billion). These assets have been classified
as available-for-sale securities and measured at
fair value.
Total assets of HSBC’s non-money market funds,
which are on-balance sheet
2007 2006
US$bn US$bn
Specialist funds .............................. 1.0 0.4
Local Investment Management
funds .......................................... 3.1 1.9
4.1 2.3
Total assets of HSBC’s non-money market funds
which are on-balance sheet, by balance sheet
classification
2007 2006
US$bn US$bn
Cash ................................................ 0.4 0.2
Trading assets ................................ 0.5 0.2
Financial instruments
designated at fair value .............. 3.0 1.8
Financial investments .................... 0.2 0.1
4.1 2.3
Conduits
HSBC sponsors and manages two types of conduits
which issue CP; multi-seller conduits and securities
investment conduits. HSBC consolidated these
conduits from inception because it is exposed to the
majority of risks and rewards of ownership.
Multi-seller conduits have been established for
the purpose of providing alternative sources of
financing to HSBC’s clients, for example, in respect
of discrete pools of vehicle finance loan receivables.
The multi-seller conduits purchase or fund
interests in diversified pools of third party assets,
which are financed by the issuance of CP. The cash
flows received by the conduits are utilised to service
payments to clients and to provide a commercial rate
of return for HSBC. CP issued by the multi-seller