HSBC 2007 Annual Report Download - page 57
Download and view the complete annual report
Please find page 57 of the 2007 HSBC annual report below. You can navigate through the pages in the report by either clicking on the pages listed below, or by using the keyword search tool below to find specific information within the annual report.-
 1
1 -
2
-
3
-
4
-
5
-
6
-
7
-
8
-
9
-
10
-
11
-
12
-
13
-
14
-
15
-
16
-
17
-
18
-
19
-
20
-
21
-
22
-
23
-
24
-
25
-
26
-
27
-
28
-
29
-
30
-
31
-
32
-
33
-
34
-
35
-
36
-
37
-
38
-
39
-
40
-
41
-
42
-
43
-
44
-
45
-
46
-
 47
47 -
 48
48 -
 49
49 -
 50
50 -
 51
51 -
 52
52 -
 53
53 -
 54
54 -
 55
55 -
 56
56 -
 57
57 -
 58
58 -
 59
59 -
 60
60 -
 61
61 -
 62
62 -
 63
63 -
 64
64 -
 65
65 -
 66
66 -
 67
67 -
68
-
69
-
70
-
71
-
72
-
73
-
74
-
75
-
76
-
77
-
78
-
79
-
80
-
81
-
82
-
83
-
84
-
85
-
86
-
87
-
88
-
89
-
90
-
91
-
92
-
93
-
94
-
95
-
96
-
97
-
98
-
99
-
100
-
101
-
102
-
103
-
104
-
105
-
106
-
107
-
108
-
109
-
110
-
111
-
112
-
113
-
114
-
115
-
116
-
117
-
118
-
119
-
120
-
121
-
122
-
123
-
124
-
125
-
126
-
127
-
128
-
129
-
130
-
131
-
132
-
133
-
134
-
135
-
136
-
137
-
138
-
139
-
140
-
141
-
142
-
143
-
144
-
145
-
146
-
147
-
148
-
149
-
150
-
151
-
152
-
153
-
154
-
155
-
156
-
157
-
158
-
159
-
160
-
161
-
162
-
163
-
164
-
165
-
166
-
167
-
168
-
169
-
170
-
171
-
172
-
173
-
174
-
175
-
176
-
177
-
178
-
179
-
180
-
181
-
182
-
183
-
184
-
185
-
186
-
187
-
188
-
189
-
190
-
191
-
192
-
193
-
194
-
195
-
196
-
197
-
198
-
199
-
200
-
201
-
202
-
203
-
204
-
205
-
206
-
207
-
208
-
209
-
210
-
211
-
212
-
213
-
214
-
215
-
216
-
217
-
218
-
219
-
220
-
221
-
222
-
223
-
224
-
225
-
226
-
227
-
228
-
229
-
230
-
231
-
232
-
233
-
234
-
235
-
236
-
237
-
238
-
239
-
240
-
241
-
242
-
243
-
244
-
245
-
246
-
247
-
248
-
249
-
250
-
251
-
252
-
253
-
254
-
255
-
256
-
257
-
258
-
259
-
260
-
261
-
262
-
263
-
264
-
265
-
266
-
267
-
268
-
269
-
270
-
271
-
272
-
273
-
274
-
275
-
276
-
277
-
278
-
279
-
280
-
281
-
282
-
283
-
284
-
285
-
286
-
287
-
288
-
289
-
290
-
291
-
292
-
293
-
294
-
295
-
296
-
297
-
298
-
299
-
300
-
301
-
302
-
303
-
304
-
305
-
306
-
307
-
308
-
309
-
310
-
311
-
312
-
313
-
314
-
315
-
316
-
317
-
318
-
319
-
320
-
321
-
322
-
323
-
324
-
325
-
326
-
327
-
328
-
329
-
330
-
331
-
332
-
333
-
334
-
335
-
336
-
337
-
338
-
339
-
340
-
341
-
342
-
343
-
344
-
345
-
346
-
347
-
348
-
349
-
350
-
351
-
352
-
353
-
354
-
355
-
356
-
357
-
358
-
359
-
360
-
361
-
362
-
363
-
364
-
365
-
366
-
367
-
368
-
369
-
370
-
371
-
372
-
373
-
374
-
375
-
376
-
377
-
378
-
379
-
380
-
381
-
382
-
383
-
384
-
385
-
386
-
387
-
388
-
389
-
390
-
391
-
392
-
393
-
394
-
395
-
396
-
397
-
398
-
399
-
400
-
401
-
402
-
403
-
404
-
405
-
406
-
407
-
408
-
409
-
410
-
411
-
412
-
413
-
414
-
415
-
416
-
417
-
418
-
419
-
420
-
421
-
422
-
423
-
424
-
425
-
426
-
427
-
428
-
429
-
430
-
431
-
432
-
433
-
434
-
435
-
436
-
437
-
438
-
439
-
440
-
441
-
442
-
443
-
444
-
445
-
446
-
447
-
448
-
449
-
450
-
451
-
452
-
453
-
454
-
455
-
456
-
457
-
458
-
459
-
460
-
461
-
462
-
463
-
464
-
465
-
466
-
467
-
468
-
469
-
470
-
471
-
472
-
473
-
474
-
475
-
476
 |
 |
55
in various businesses and performance-related
compensation in Global Markets, where revenues
increased by 36 per cent. Costs in 2006 also reflected
the full-year effect of the investment made
throughout 2005 as well as ongoing investment in
product development, particularly in structured
derivatives and Credit and Rates. In HSBC Global
Asset Management, a robust performance resulted in
higher staff and support costs.
A rise in operational expenditure was driven by
increased volumes as well as new business won in
respect of payments and cash management funds
administration, securities services and Group
Investment Businesses.
The decline in HSBC’s share of profits in
associates and joint ventures reflected a loss arising
from an impairment charge on a private equity
investment within an associate. This was
compounded by the non-recurrence of one-off gains
realised in 2005, a significant proportion of which
were recognised in the second half of the year.
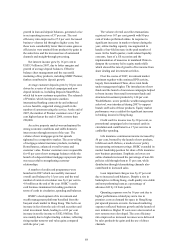
Private Banking delivered a record pre-tax
profit of US$805 million in Europe, an increase of
48 per cent compared with 2005. The cost efficiency
ratio improved by 6.7 percentage points to 55.7 per
cent. There was a US$108 million gain on the partial
sale of an investment in the Hermitage Fund and,
excluding this, pre-tax profit increased by 28 per
cent. This result was achieved through growth in
client assets, increased lending and transaction
volumes and distribution of a broader and more
sophisticated product range. Growth in intra-Group
referrals with other customer groups was
encouraging and also contributed to increased
revenues.
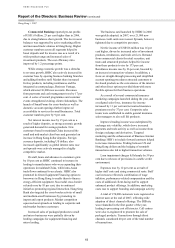
Net interest income was 23 per cent higher at
US$675 million, driven by balance sheet growth,
primarily in the UK and Switzerland. Lending
balances were 24 per cent higher and were funded by
increased deposits. In the UK, the 31 per cent
expansion of the lending book resulted primarily
from growth in mortgage balances driven by a
market which remained buoyant at the upper end. In
Switzerland, an 18 per cent rise in lending largely
reflected client appetite for leverage to facilitate
equity and alternative investment opportunities.
Fee income increased by 19 per cent to
US$869 million. This growth resulted from
increased funds under management and a favourable
mix change towards higher fee-generating
discretionary and advisory managed funds, including
the continued success of the Structured Investment
Solutions (‘SIS’) and Core Investment Solutions
(‘CIS’) products and the launch of the Actively
Managed Portfolio product. A significant
performance fee came from the Hermitage Fund, a
public equity fund dedicated to Russia, which was
US$23 million greater than in 2005. The expansion
of HSBC’s residential property advisory business,
which opened new offices in the UK and France,
also contributed to fee income growth.
Gains from financial investments in both 2005
and 2006 arose mainly from the sale of debt and
investment holdings. Gains in 2006 included
US$108 million from the partial disposal of HSBC’s
investment in the Hermitage Fund.
Excluding gains from financial investments,
trading and other operating income was marginally
lower than in 2005.
Client assets, including deposits, rose by 18 per
cent to US$218 billion. Net new money was
US$19 billion, with the largest inflows arising in
Switzerland and the UK. In Switzerland, improved
brand awareness, successful product placement and
cross-referrals with other customer groups, all
contributed to significant net new money of
US$11 billion. In the UK, net new money of
US$3 billion was garnered from referrals from
Commercial Banking and the retail network, new
regional offices and continued growth in the
underlying business. Net new money in Monaco and
Germany exceeded US$1 billion and US$2 billion,
respectively, also contributing to the growth in client
assets. The value of clients’ investments in HSBC’s
discretionary managed suite of SIS and CIS products
grew very strongly, reaching US$1.7 billion.
Operating expenses were 13 per cent higher
than in 2005 due to higher performance-related
remuneration, recruitment of client-facing
professionals across the region to support the
growth of the business, and continued investment
in the recently opened UK regional offices. The
combination of HSBC’s principal trust businesses in
Switzerland also added to costs in 2006 but is
expected to bring efficiency gains in subsequent
years. Overall increased expenses were more than
offset by greater revenue generation which
contributed to the 6.7 per cent improvement in the
cost efficiency ratio.
In Other, increases in US interest rates led to
higher earnings on capital, which were partly offset
by increased subordinated debt-servicing costs.
Movements in the fair value of own debt and
associated hedges were US$33 million, compared
with an adverse movement of US$15 million in
2005, principally from movements in HSBC’s
own credit spread. The fair value of own debt