HSBC 2007 Annual Report Download - page 54
Download and view the complete annual report
Please find page 54 of the 2007 HSBC annual report below. You can navigate through the pages in the report by either clicking on the pages listed below, or by using the keyword search tool below to find specific information within the annual report.-
 1
1 -
2
-
3
-
4
-
5
-
6
-
7
-
8
-
9
-
10
-
11
-
12
-
13
-
14
-
15
-
16
-
17
-
18
-
19
-
20
-
21
-
22
-
23
-
24
-
25
-
26
-
27
-
28
-
29
-
30
-
31
-
32
-
33
-
34
-
35
-
36
-
37
-
38
-
39
-
40
-
41
-
42
-
43
-
 44
44 -
 45
45 -
 46
46 -
 47
47 -
 48
48 -
 49
49 -
 50
50 -
 51
51 -
 52
52 -
 53
53 -
 54
54 -
 55
55 -
 56
56 -
 57
57 -
 58
58 -
 59
59 -
 60
60 -
 61
61 -
 62
62 -
 63
63 -
 64
64 -
65
-
66
-
67
-
68
-
69
-
70
-
71
-
72
-
73
-
74
-
75
-
76
-
77
-
78
-
79
-
80
-
81
-
82
-
83
-
84
-
85
-
86
-
87
-
88
-
89
-
90
-
91
-
92
-
93
-
94
-
95
-
96
-
97
-
98
-
99
-
100
-
101
-
102
-
103
-
104
-
105
-
106
-
107
-
108
-
109
-
110
-
111
-
112
-
113
-
114
-
115
-
116
-
117
-
118
-
119
-
120
-
121
-
122
-
123
-
124
-
125
-
126
-
127
-
128
-
129
-
130
-
131
-
132
-
133
-
134
-
135
-
136
-
137
-
138
-
139
-
140
-
141
-
142
-
143
-
144
-
145
-
146
-
147
-
148
-
149
-
150
-
151
-
152
-
153
-
154
-
155
-
156
-
157
-
158
-
159
-
160
-
161
-
162
-
163
-
164
-
165
-
166
-
167
-
168
-
169
-
170
-
171
-
172
-
173
-
174
-
175
-
176
-
177
-
178
-
179
-
180
-
181
-
182
-
183
-
184
-
185
-
186
-
187
-
188
-
189
-
190
-
191
-
192
-
193
-
194
-
195
-
196
-
197
-
198
-
199
-
200
-
201
-
202
-
203
-
204
-
205
-
206
-
207
-
208
-
209
-
210
-
211
-
212
-
213
-
214
-
215
-
216
-
217
-
218
-
219
-
220
-
221
-
222
-
223
-
224
-
225
-
226
-
227
-
228
-
229
-
230
-
231
-
232
-
233
-
234
-
235
-
236
-
237
-
238
-
239
-
240
-
241
-
242
-
243
-
244
-
245
-
246
-
247
-
248
-
249
-
250
-
251
-
252
-
253
-
254
-
255
-
256
-
257
-
258
-
259
-
260
-
261
-
262
-
263
-
264
-
265
-
266
-
267
-
268
-
269
-
270
-
271
-
272
-
273
-
274
-
275
-
276
-
277
-
278
-
279
-
280
-
281
-
282
-
283
-
284
-
285
-
286
-
287
-
288
-
289
-
290
-
291
-
292
-
293
-
294
-
295
-
296
-
297
-
298
-
299
-
300
-
301
-
302
-
303
-
304
-
305
-
306
-
307
-
308
-
309
-
310
-
311
-
312
-
313
-
314
-
315
-
316
-
317
-
318
-
319
-
320
-
321
-
322
-
323
-
324
-
325
-
326
-
327
-
328
-
329
-
330
-
331
-
332
-
333
-
334
-
335
-
336
-
337
-
338
-
339
-
340
-
341
-
342
-
343
-
344
-
345
-
346
-
347
-
348
-
349
-
350
-
351
-
352
-
353
-
354
-
355
-
356
-
357
-
358
-
359
-
360
-
361
-
362
-
363
-
364
-
365
-
366
-
367
-
368
-
369
-
370
-
371
-
372
-
373
-
374
-
375
-
376
-
377
-
378
-
379
-
380
-
381
-
382
-
383
-
384
-
385
-
386
-
387
-
388
-
389
-
390
-
391
-
392
-
393
-
394
-
395
-
396
-
397
-
398
-
399
-
400
-
401
-
402
-
403
-
404
-
405
-
406
-
407
-
408
-
409
-
410
-
411
-
412
-
413
-
414
-
415
-
416
-
417
-
418
-
419
-
420
-
421
-
422
-
423
-
424
-
425
-
426
-
427
-
428
-
429
-
430
-
431
-
432
-
433
-
434
-
435
-
436
-
437
-
438
-
439
-
440
-
441
-
442
-
443
-
444
-
445
-
446
-
447
-
448
-
449
-
450
-
451
-
452
-
453
-
454
-
455
-
456
-
457
-
458
-
459
-
460
-
461
-
462
-
463
-
464
-
465
-
466
-
467
-
468
-
469
-
470
-
471
-
472
-
473
-
474
-
475
-
476
 |
 |

HSBC HOLDINGS PLC
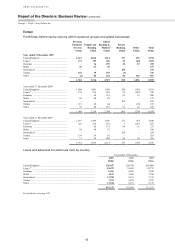
Report of the Directors: Business Review (continued)
Europe > 2006
52
lower insurance sales and a reduction in average
premiums.
In France, banking fees rose through higher
sales of packaged current accounts. Transactional
and overdraft fees and insurance distribution fees
also increased, reflecting growth in the customer
base. In Turkey, strong growth in lending volumes
and, to a lesser extent, credit cards, helped drive fee
income growth. Additional sales staff were recruited
to reinforce the emphasis on wealth management,
and the launch of new pension products also helped
boost fees.
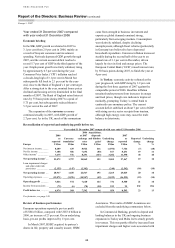
In 2006, MasterCard became publicly listed
through an IPO, and the US$37 million gain from
financial investments mainly reflected Personal
Financial Services’ share of the proceeds of the IPO.
Responding to changes in work and shopping
patterns among its customers and the increasing
acceptance of direct channels, HSBC appraised its
UK property portfolio during the year. Higher other
operating income reflected Personal Financial
Services’ share of revenue from branch sale and
lease-back transactions. Personal Financial Services’
US$37 million share income on the sale of HSBC’s
stake in Cyprus Popular Bank was also included
within other operating income.
Lower sales of life and creditor repayment
protection, which were driven by the constraints on
personal lending growth referred to above, and a
change in reinsurance arrangements at the end of
2005, contributed to the decrease in net earned
insurance premiums. Lower sales of investment-
linked insurance products, together with the effect of
market movements on related insurance and
investment assets, contributed to the decline in net
income from financial instruments designated at fair
value. This was largely offset by a corresponding
decrease in net insurance claims and movements in
policyholders’ liabilities.
Loan impairment charges and other credit risk
provisions of US$1.8 billion were 6 per cent higher
than in 2005, largely reflecting lending growth in the
region.
In the UK, the 8 per cent rise in loan impairment
charges was broadly in line with lending growth.
Actions taken on underwriting and collection
activities mitigated a continuation of the rising trend
in personal bankruptcies and IVAs seen since the
legislative change in 2004. In 2006, IVAs became
the main driver of loan impairment growth across the
industry as the availability and marketing of third-
party debt reduction services increased.
Within the UK, loan impairment was most
pronounced in consumer finance unsecured
portfolios, in which delinquency also rose as the
effect of interest rate increases on relatively high
levels of indebtedness put pressure on household
cash flows. In HSBC’s other portfolios, action
undertaken by HSBC during 2005 and early 2006,
predominantly tightening underwriting criteria and
collections procedures, proved successful in
improving credit quality indicators on more recently
written debt. In the second half of 2006, HSBC
strengthened the measures available to manage
insolvencies and impaired debt including, inter alia,
the further development of predictive modelling to
enhance underwriting decisions.
In France, credit quality was sound
notwithstanding strong growth in customer
advances, and the loan impairment charge remained
low. In Turkey, overall credit quality was also
sound, and delinquency on credit cards improved
following enhanced collections efforts and changes
in government regulation. This was reflected in a
36 per cent reduction in loan impairment charges.
Operating expenses increased by 7 per cent.
A US$57 million write-down of intangibles was
attributed to card portfolios acquired in the UK
which were written off in the light of the higher
impairment charges being experienced. Excluding
this item, the increase was 6 per cent, primarily
reflecting investment in upgrading and expanding
capacity and infrastructure across the region.
In the UK, 104 branches were refurbished
during 2006. Responding to changing customer
preferences and upgrading its customer service,
HSBC extended its opening hours in certain
branches, necessitating the recruitment of additional
counter staff, and increased its IT investment in self-
service machines and other direct banking channels,
in the process improving cost efficiency.
In France, there was a 4 per cent rise in
operating expenses, driven by the recruitment of
additional sales staff, higher marketing expenditure
to attract new customers, and the migration to a
common IT infrastructure. In Turkey, the opening of
37 new branches and associated growth in numbers
of sales staff and infrastructure costs drove a 26 per
cent rise in costs. Marketing expenditure also
increased in support of the growing consumer
lending, insurance and pensions businesses.
Commercial Banking reported a pre-tax profit
of US$2.2 billion, an increase of 14 per cent
compared with 2005. Adjusting for the sale of the
UK fleet management and vehicle finance leasing
business, which was sold in the autumn of 2005,