HSBC 2007 Annual Report Download - page 104
Download and view the complete annual report
Please find page 104 of the 2007 HSBC annual report below. You can navigate through the pages in the report by either clicking on the pages listed below, or by using the keyword search tool below to find specific information within the annual report.-
 1
1 -
 2
2 -
 3
3 -
 4
4 -
 5
5 -
 6
6 -
 7
7 -
 8
8 -
 9
9 -
 10
10 -
 11
11 -
 12
12 -
 13
13 -
 14
14 -
 15
15 -
 16
16 -
 17
17 -
 18
18 -
 19
19 -
 20
20 -
 21
21 -
 22
22 -
 23
23 -
 24
24 -
 25
25 -
 26
26 -
 27
27 -
 28
28 -
 29
29 -
 30
30 -
 31
31 -
 32
32 -
 33
33 -
 34
34 -
 35
35 -
 36
36 -
 37
37 -
 38
38 -
 39
39 -
 40
40 -
 41
41 -
 42
42 -
 43
43 -
 44
44 -
 45
45 -
 46
46 -
 47
47 -
 48
48 -
 49
49 -
 50
50 -
 51
51 -
 52
52 -
 53
53 -
 54
54 -
 55
55 -
 56
56 -
 57
57 -
 58
58 -
 59
59 -
 60
60 -
 61
61 -
 62
62 -
 63
63 -
 64
64 -
 65
65 -
 66
66 -
 67
67 -
 68
68 -
 69
69 -
 70
70 -
 71
71 -
 72
72 -
 73
73 -
 74
74 -
 75
75 -
 76
76 -
 77
77 -
 78
78 -
 79
79 -
 80
80 -
 81
81 -
 82
82 -
 83
83 -
 84
84 -
 85
85 -
 86
86 -
 87
87 -
 88
88 -
 89
89 -
 90
90 -
 91
91 -
 92
92 -
 93
93 -
 94
94 -
 95
95 -
 96
96 -
 97
97 -
 98
98 -
 99
99 -
 100
100 -
 101
101 -
 102
102 -
 103
103 -
 104
104 -
 105
105 -
 106
106 -
 107
107 -
 108
108 -
 109
109 -
 110
110 -
 111
111 -
 112
112 -
 113
113 -
 114
114 -
 115
115 -
 116
116 -
 117
117 -
 118
118 -
 119
119 -
 120
120 -
 121
121 -
 122
122 -
 123
123 -
 124
124 -
 125
125 -
 126
126 -
 127
127 -
 128
128 -
 129
129 -
 130
130 -
 131
131 -
 132
132 -
 133
133 -
 134
134 -
 135
135 -
 136
136 -
 137
137 -
 138
138 -
 139
139 -
 140
140 -
 141
141 -
 142
142 -
 143
143 -
 144
144 -
 145
145 -
 146
146 -
 147
147 -
 148
148 -
 149
149 -
 150
150 -
 151
151 -
 152
152 -
 153
153 -
 154
154 -
 155
155 -
 156
156 -
 157
157 -
 158
158 -
 159
159 -
 160
160 -
 161
161 -
 162
162 -
 163
163 -
 164
164 -
 165
165 -
 166
166 -
 167
167 -
 168
168 -
 169
169 -
 170
170 -
 171
171 -
 172
172 -
 173
173 -
 174
174 -
 175
175 -
 176
176 -
 177
177 -
 178
178 -
 179
179 -
 180
180 -
 181
181 -
 182
182 -
 183
183 -
 184
184 -
 185
185 -
 186
186 -
 187
187 -
 188
188 -
 189
189 -
 190
190 -
 191
191 -
 192
192 -
 193
193 -
 194
194 -
 195
195 -
 196
196 -
 197
197 -
 198
198 -
 199
199 -
 200
200 -
 201
201 -
 202
202 -
 203
203 -
 204
204 -
 205
205 -
 206
206 -
 207
207 -
 208
208 -
 209
209 -
 210
210 -
 211
211 -
 212
212 -
 213
213 -
 214
214 -
 215
215 -
 216
216 -
 217
217 -
 218
218 -
 219
219 -
 220
220 -
 221
221 -
 222
222 -
 223
223 -
 224
224 -
 225
225 -
 226
226 -
 227
227 -
 228
228 -
 229
229 -
 230
230 -
 231
231 -
 232
232 -
 233
233 -
 234
234 -
 235
235 -
 236
236 -
 237
237 -
 238
238 -
 239
239 -
 240
240 -
 241
241 -
 242
242 -
 243
243 -
 244
244 -
 245
245 -
 246
246 -
 247
247 -
 248
248 -
 249
249 -
 250
250 -
 251
251 -
 252
252 -
 253
253 -
 254
254 -
 255
255 -
 256
256 -
 257
257 -
 258
258 -
 259
259 -
 260
260 -
 261
261 -
 262
262 -
 263
263 -
 264
264 -
 265
265 -
 266
266 -
 267
267 -
 268
268 -
 269
269 -
 270
270 -
 271
271 -
 272
272 -
 273
273 -
 274
274 -
 275
275 -
 276
276 -
 277
277 -
 278
278 -
 279
279 -
 280
280 -
 281
281 -
 282
282 -
 283
283 -
 284
284 -
 285
285 -
 286
286 -
 287
287 -
 288
288 -
 289
289 -
 290
290 -
 291
291 -
 292
292 -
 293
293 -
 294
294 -
 295
295 -
 296
296 -
 297
297 -
 298
298 -
 299
299 -
 300
300 -
 301
301 -
 302
302 -
 303
303 -
 304
304 -
 305
305 -
 306
306 -
 307
307 -
 308
308 -
 309
309 -
 310
310 -
 311
311 -
 312
312 -
 313
313 -
 314
314 -
 315
315 -
 316
316 -
 317
317 -
 318
318 -
 319
319 -
 320
320 -
 321
321 -
 322
322 -
 323
323 -
 324
324 -
 325
325 -
 326
326 -
 327
327 -
 328
328 -
 329
329 -
 330
330 -
 331
331 -
 332
332 -
 333
333 -
 334
334 -
 335
335 -
 336
336 -
 337
337 -
 338
338 -
 339
339 -
 340
340 -
 341
341 -
 342
342 -
 343
343 -
 344
344 -
 345
345 -
 346
346 -
 347
347 -
 348
348 -
 349
349 -
 350
350 -
 351
351 -
 352
352 -
 353
353 -
 354
354 -
 355
355 -
 356
356 -
 357
357 -
 358
358 -
 359
359 -
 360
360 -
 361
361 -
 362
362 -
 363
363 -
 364
364 -
 365
365 -
 366
366 -
 367
367 -
 368
368 -
 369
369 -
 370
370 -
 371
371 -
 372
372 -
 373
373 -
 374
374 -
 375
375 -
 376
376 -
 377
377 -
 378
378 -
 379
379 -
 380
380 -
 381
381 -
 382
382 -
 383
383 -
 384
384 -
 385
385 -
 386
386 -
 387
387 -
 388
388 -
 389
389 -
 390
390 -
 391
391 -
 392
392 -
 393
393 -
 394
394 -
 395
395 -
 396
396 -
 397
397 -
 398
398 -
 399
399 -
 400
400 -
 401
401 -
 402
402 -
 403
403 -
 404
404 -
 405
405 -
 406
406 -
 407
407 -
 408
408 -
 409
409 -
 410
410 -
 411
411 -
 412
412 -
 413
413 -
 414
414 -
 415
415 -
 416
416 -
 417
417 -
 418
418 -
 419
419 -
 420
420 -
 421
421 -
 422
422 -
 423
423 -
 424
424 -
 425
425 -
 426
426 -
 427
427 -
 428
428 -
 429
429 -
 430
430 -
 431
431 -
 432
432 -
 433
433 -
 434
434 -
 435
435 -
 436
436 -
 437
437 -
 438
438 -
 439
439 -
 440
440 -
 441
441 -
 442
442 -
 443
443 -
 444
444 -
 445
445 -
 446
446 -
 447
447 -
 448
448 -
 449
449 -
 450
450 -
 451
451 -
 452
452 -
 453
453 -
 454
454 -
 455
455 -
 456
456 -
 457
457 -
 458
458 -
 459
459 -
 460
460 -
 461
461 -
 462
462 -
 463
463 -
 464
464 -
 465
465 -
 466
466 -
 467
467 -
 468
468 -
 469
469 -
 470
470 -
 471
471 -
 472
472 -
 473
473 -
 474
474 -
 475
475 -
 476
476
 |
 |

HSBC HOLDINGS PLC
Report of the Directors: Business Review (continued)
North America > 2006
102
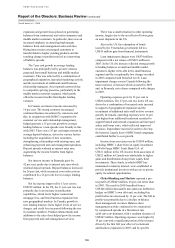
though this was offset by reduced partnership
payments to those merchants.
Growth opportunities in the motor vehicle
financing industry were particularly challenging in
2006, driven by a reduction in incentive programmes
offered by manufacturers and a rising interest rate
environment. Notwithstanding these factors, average
balances rose by 12 per cent. This was led by strong
organic growth in the near-prime portfolio from an
increased emphasis on strengthening relationships
with active dealers, and greater volumes generated
from the consumer direct programme. Refinancing
volumes rose, directly attributable to the successful
consumer refinance programme, which recorded a
48 per cent increase in originations.
In Canada, net interest income rose by 16 per
cent due to lending and deposit growth. Average
mortgage balances grew as a result of the continued
strength of the housing market and ongoing branch
expansion in the consumer finance business. The
strong economy drove higher levels of unsecured
lending as consumer spending rose. Expansion of the
consumer finance motor vehicle proposition and the
launch of a MasterCard programme in 2005
contributed further to asset growth, while increased
marketing activity led to a rise in personal non-credit
card lending balances. Asset spreads narrowed,
largely from lower yields which reflected changes in
product mix and competitive market conditions.
Average deposit balances grew by 6 per cent
compared with 2005, with the notable success of a
new high rate savings account and a sale campaign
celebrating HSBC’s 25th anniversary in Canada.
Deposit spreads widened as interest rates rose,
contributing further to the increase in net interest
income.
Net fee income grew by 13 per cent to
US$3.7 billion, with increases in both the US and
Canada. The 13 per cent rise in the US was largely
led by higher fees from the credit card and retail
services businesses. Credit card fee income from the
consumer finance business increased by 8 per cent,
primarily from balance growth in the non-prime
portfolio, improved interchange rates and lower fee
charge-offs. Revenues from credit card partnership
enhancement services rose due to greater sales
volumes, expansion into new customer segments and
balance growth.
Within the US retail services business, net fee
income rose, reflecting lower merchant payments, in
part due to changes in contract obligations with
certain merchants. A rise in late fees from growth in
customer account balances and higher fees on
overdue payments contributed further to the
increase.
In the US mortgage-banking business, net fee
income declined. Although mortgage loan service
volumes grew in 2006, contributing additional fee
income from the greater proportion of mortgages
originated and then sold with mortgage servicing
rights (‘MSRs’) retained, these benefits were more
than offset by higher amortisation charges and lower
releases of temporary impairment provisions on
MSRs. The taxpayer financial services business
generated higher fee income from increased loan
volumes during the 2006 tax season.
In Canada, net fee income rose by 5 per cent to
US$217 million. Continued growth in the wealth
management business resulted in higher investment
administration fees, and credit card fee income rose,
driven by increased lending.
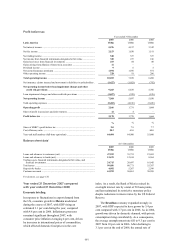
Trading income fell by 17 per cent, due to lower
income on HSBC Finance’s Decision One mortgage
balances held for resale to secondary market
purchasers. This primarily reflected additional losses
incurred following the repurchase of certain
mortgages previously sold to external third parties
which had subsequently gone into default. Higher
losses on derivatives that did not meet the criteria for
hedge accounting contributed further to the decrease.
A US$20 million gain from the MasterCard
Incorporated IPO was the key reason for the increase
in gains from financial instruments.
Other operating income also rose, primarily
driven by gains on various asset disposals. Most
notably, a US$123 million profit was achieved on
disposal of HSBC’s investment in Kanbay
International Inc, a worldwide information
technology services firm. Income from overnight
and short-term money market investments also rose.
These benefits were partly offset by greater losses
incurred on sales of repossessed properties,
following a 42 per cent rise in such properties as
customers defaulted on their mortgage payments.
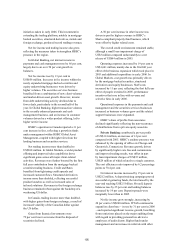
Loan impairment charges and other credit risk
provisions of US$6.7 billion were 28 per cent higher
than in 2005. In the US, loan impairment charges
rose by 28 per cent despite the non-recurrence of
significant charges which arose in 2005 following
hurricane Katrina and increased levels of bankruptcy
filings in the final quarter of the year. Loan
impairment charges were also higher in the second
half of 2006 compared with both the preceding half
and the second half of 2005. The increase was
primarily driven by significantly higher
delinquencies and losses in the mortgage services
