HSBC 2007 Annual Report Download - page 63
Download and view the complete annual report
Please find page 63 of the 2007 HSBC annual report below. You can navigate through the pages in the report by either clicking on the pages listed below, or by using the keyword search tool below to find specific information within the annual report.-
 1
1 -
2
-
3
-
4
-
5
-
6
-
7
-
8
-
9
-
10
-
11
-
12
-
13
-
14
-
15
-
16
-
17
-
18
-
19
-
20
-
21
-
22
-
23
-
24
-
25
-
26
-
27
-
28
-
29
-
30
-
31
-
32
-
33
-
34
-
35
-
36
-
37
-
38
-
39
-
40
-
41
-
42
-
43
-
44
-
45
-
46
-
47
-
48
-
49
-
50
-
51
-
52
-
 53
53 -
 54
54 -
 55
55 -
 56
56 -
 57
57 -
 58
58 -
 59
59 -
 60
60 -
 61
61 -
 62
62 -
 63
63 -
 64
64 -
 65
65 -
 66
66 -
 67
67 -
 68
68 -
 69
69 -
 70
70 -
 71
71 -
 72
72 -
 73
73 -
74
-
75
-
76
-
77
-
78
-
79
-
80
-
81
-
82
-
83
-
84
-
85
-
86
-
87
-
88
-
89
-
90
-
91
-
92
-
93
-
94
-
95
-
96
-
97
-
98
-
99
-
100
-
101
-
102
-
103
-
104
-
105
-
106
-
107
-
108
-
109
-
110
-
111
-
112
-
113
-
114
-
115
-
116
-
117
-
118
-
119
-
120
-
121
-
122
-
123
-
124
-
125
-
126
-
127
-
128
-
129
-
130
-
131
-
132
-
133
-
134
-
135
-
136
-
137
-
138
-
139
-
140
-
141
-
142
-
143
-
144
-
145
-
146
-
147
-
148
-
149
-
150
-
151
-
152
-
153
-
154
-
155
-
156
-
157
-
158
-
159
-
160
-
161
-
162
-
163
-
164
-
165
-
166
-
167
-
168
-
169
-
170
-
171
-
172
-
173
-
174
-
175
-
176
-
177
-
178
-
179
-
180
-
181
-
182
-
183
-
184
-
185
-
186
-
187
-
188
-
189
-
190
-
191
-
192
-
193
-
194
-
195
-
196
-
197
-
198
-
199
-
200
-
201
-
202
-
203
-
204
-
205
-
206
-
207
-
208
-
209
-
210
-
211
-
212
-
213
-
214
-
215
-
216
-
217
-
218
-
219
-
220
-
221
-
222
-
223
-
224
-
225
-
226
-
227
-
228
-
229
-
230
-
231
-
232
-
233
-
234
-
235
-
236
-
237
-
238
-
239
-
240
-
241
-
242
-
243
-
244
-
245
-
246
-
247
-
248
-
249
-
250
-
251
-
252
-
253
-
254
-
255
-
256
-
257
-
258
-
259
-
260
-
261
-
262
-
263
-
264
-
265
-
266
-
267
-
268
-
269
-
270
-
271
-
272
-
273
-
274
-
275
-
276
-
277
-
278
-
279
-
280
-
281
-
282
-
283
-
284
-
285
-
286
-
287
-
288
-
289
-
290
-
291
-
292
-
293
-
294
-
295
-
296
-
297
-
298
-
299
-
300
-
301
-
302
-
303
-
304
-
305
-
306
-
307
-
308
-
309
-
310
-
311
-
312
-
313
-
314
-
315
-
316
-
317
-
318
-
319
-
320
-
321
-
322
-
323
-
324
-
325
-
326
-
327
-
328
-
329
-
330
-
331
-
332
-
333
-
334
-
335
-
336
-
337
-
338
-
339
-
340
-
341
-
342
-
343
-
344
-
345
-
346
-
347
-
348
-
349
-
350
-
351
-
352
-
353
-
354
-
355
-
356
-
357
-
358
-
359
-
360
-
361
-
362
-
363
-
364
-
365
-
366
-
367
-
368
-
369
-
370
-
371
-
372
-
373
-
374
-
375
-
376
-
377
-
378
-
379
-
380
-
381
-
382
-
383
-
384
-
385
-
386
-
387
-
388
-
389
-
390
-
391
-
392
-
393
-
394
-
395
-
396
-
397
-
398
-
399
-
400
-
401
-
402
-
403
-
404
-
405
-
406
-
407
-
408
-
409
-
410
-
411
-
412
-
413
-
414
-
415
-
416
-
417
-
418
-
419
-
420
-
421
-
422
-
423
-
424
-
425
-
426
-
427
-
428
-
429
-
430
-
431
-
432
-
433
-
434
-
435
-
436
-
437
-
438
-
439
-
440
-
441
-
442
-
443
-
444
-
445
-
446
-
447
-
448
-
449
-
450
-
451
-
452
-
453
-
454
-
455
-
456
-
457
-
458
-
459
-
460
-
461
-
462
-
463
-
464
-
465
-
466
-
467
-
468
-
469
-
470
-
471
-
472
-
473
-
474
-
475
-
476
 |
 |
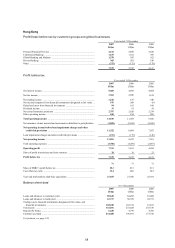
61
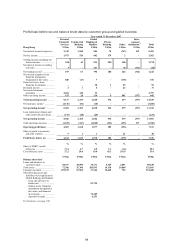
growth in loan and deposit balances, generated a rise
in net operating income of 37 per cent. The cost
efficiency ratio improved to 27.2 per cent. Increased
business volumes fed through to higher costs, but
these were considerably lower than revenue gains as
efficiencies were attained from productivity gains in
the sales force and the increased use of automated
channels and straight-through processing.
Net interest income grew by 16 per cent to
US$3.3 billion in 2007, due to better margins and
growth of average deposit balances. Effective
balance sheet management and the successful
marketing of key products, including HSBC Premier,
further contributed to deposit growth.
Average customer deposits grew by 10 per cent,
driven by a series of tactical campaigns and new
deposit initiatives, including Deposits SmartPicks,
which led to new customer acquisition. The relaunch
of Premier, which incorporates seamless
international banking connectivity and enhanced
service benefits, supported strong growth in the
number of customers using the service. At the end of
2007, the number of Premier customers was 15 per
cent higher than at the end of 2006, at more than
290,000.
An active property market was underpinned by
strong economic conditions and stable domestic
interest rates throughout most of the year. The
volume of new mortgages grew but spreads
tightened in a competitive market. The cross-selling
of mortgage-related insurance products, including
HomeSurance, enhanced overall revenue and
customer value. Premier customers were responsible
for 45 per cent of new mortgage balances while the
launch of a deposit-linked mortgage repayment plan
was successful in strengthening customer
relationships.
A number of credit card programmes were
launched in 2007 which successfully increased
overall card balances by 15 per cent, and the total
number of cards in circulation rose by 6 per cent to
4.9 million at the end of the year. HSBC’s credit
card business maintained its leading position in
terms of cards in circulation, spending and balances.
HSBC’s development of its investment and
wealth management platforms benefited from the
buoyant stock market in Hong Kong. This led to an
increase in fees from the sale of retail securities and
retail investment funds, leading to a 103 per cent
increase in net fee income to US$2.0 billion. This
was mainly due to higher trading volumes, reflecting
rising market turnover and value gains compared
with the prior year.
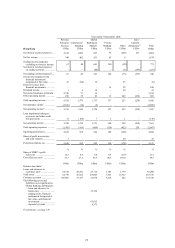
The volume of retail securities transactions
registered over 167 per cent growth with 80 per
cent of trades performed online. In response to
significant increases in market volumes during the
year, online trading capacity was augmented to
handle a four-fold increase in the peak number of
users. In the fourth quarter, credit-related liquidity
concerns, fears of a US recession and the
implementation of measures in mainland China to
dampen the economy led to equity market falls
which slowed the rate of growth of fee income from
share dealing and investment activities.
Over the course of 2007, investment market
sentiment together with continued IPO activity,
largely from mainland China, drove total funds
under management higher. The introduction of new
funds and the launch of awareness campaigns helped
to boost income from retail investment funds and
structured investment products by 144 per cent.
WealthMaster, a new portfolio wealth management
sales tool, was introduced during 2007 to support
branch staff sales of these products. Equity market
performance was a catalyst for significant increases
in broking income in Hong Kong.
Credit card fee income rose by 20 per cent, as
promotional campaigns led to increased cards in
circulation and contributed to a 17 per cent rise in
cardholder spending.
Life insurance commission income increased by
50 per cent, boosted by the launch of new products,
LifeInvest and LifeSave, a medical cover policy
incorporating retirement savings. HSBC extended its
market leadership position for share of life insurance
new business premiums. Emphasis on lower cost
online channels increased the percentage of non-life
policies sold through them to 53 per cent, while
distribution through telemarketing channels also
contributed to increased sales.
Loan impairment charges rose by 47 per cent
due to increased card balances. Despite a rise in
bankruptcies in Hong Kong, credit quality was stable
and non-performing loans as a percentage of
advances fell by 10 basis points.
Operating expenses rose by 16 per cent due to
higher performance-related pay and a rise in
premises costs as demand for space in Hong Kong
put upward pressure on rents. Increased marketing
expenses reflected business growth and the launch of
new initiatives. Higher IT costs were also incurred as
new systems were developed. The cost efficiency
ratio improved as increased revenues were delivered
by sales productivity gains and the use of direct
channels.