HSBC 2007 Annual Report Download - page 248
Download and view the complete annual report
Please find page 248 of the 2007 HSBC annual report below. You can navigate through the pages in the report by either clicking on the pages listed below, or by using the keyword search tool below to find specific information within the annual report.-
 1
1 -
2
-
3
-
4
-
5
-
6
-
7
-
8
-
9
-
10
-
11
-
12
-
13
-
14
-
15
-
16
-
17
-
18
-
19
-
20
-
21
-
22
-
23
-
24
-
25
-
26
-
27
-
28
-
29
-
30
-
31
-
32
-
33
-
34
-
35
-
36
-
37
-
38
-
39
-
40
-
41
-
42
-
43
-
44
-
45
-
46
-
47
-
48
-
49
-
50
-
51
-
52
-
53
-
54
-
55
-
56
-
57
-
58
-
59
-
60
-
61
-
62
-
63
-
64
-
65
-
66
-
67
-
68
-
69
-
70
-
71
-
72
-
73
-
74
-
75
-
76
-
77
-
78
-
79
-
80
-
81
-
82
-
83
-
84
-
85
-
86
-
87
-
88
-
89
-
90
-
91
-
92
-
93
-
94
-
95
-
96
-
97
-
98
-
99
-
100
-
101
-
102
-
103
-
104
-
105
-
106
-
107
-
108
-
109
-
110
-
111
-
112
-
113
-
114
-
115
-
116
-
117
-
118
-
119
-
120
-
121
-
122
-
123
-
124
-
125
-
126
-
127
-
128
-
129
-
130
-
131
-
132
-
133
-
134
-
135
-
136
-
137
-
138
-
139
-
140
-
141
-
142
-
143
-
144
-
145
-
146
-
147
-
148
-
149
-
150
-
151
-
152
-
153
-
154
-
155
-
156
-
157
-
158
-
159
-
160
-
161
-
162
-
163
-
164
-
165
-
166
-
167
-
168
-
169
-
170
-
171
-
172
-
173
-
174
-
175
-
176
-
177
-
178
-
179
-
180
-
181
-
182
-
183
-
184
-
185
-
186
-
187
-
188
-
189
-
190
-
191
-
192
-
193
-
194
-
195
-
196
-
197
-
198
-
199
-
200
-
201
-
202
-
203
-
204
-
205
-
206
-
207
-
208
-
209
-
210
-
211
-
212
-
213
-
214
-
215
-
216
-
217
-
218
-
219
-
220
-
221
-
222
-
223
-
224
-
225
-
226
-
227
-
228
-
229
-
230
-
231
-
232
-
233
-
234
-
235
-
236
-
237
-
 238
238 -
 239
239 -
 240
240 -
 241
241 -
 242
242 -
 243
243 -
 244
244 -
 245
245 -
 246
246 -
 247
247 -
 248
248 -
 249
249 -
 250
250 -
 251
251 -
 252
252 -
 253
253 -
 254
254 -
 255
255 -
 256
256 -
 257
257 -
 258
258 -
259
-
260
-
261
-
262
-
263
-
264
-
265
-
266
-
267
-
268
-
269
-
270
-
271
-
272
-
273
-
274
-
275
-
276
-
277
-
278
-
279
-
280
-
281
-
282
-
283
-
284
-
285
-
286
-
287
-
288
-
289
-
290
-
291
-
292
-
293
-
294
-
295
-
296
-
297
-
298
-
299
-
300
-
301
-
302
-
303
-
304
-
305
-
306
-
307
-
308
-
309
-
310
-
311
-
312
-
313
-
314
-
315
-
316
-
317
-
318
-
319
-
320
-
321
-
322
-
323
-
324
-
325
-
326
-
327
-
328
-
329
-
330
-
331
-
332
-
333
-
334
-
335
-
336
-
337
-
338
-
339
-
340
-
341
-
342
-
343
-
344
-
345
-
346
-
347
-
348
-
349
-
350
-
351
-
352
-
353
-
354
-
355
-
356
-
357
-
358
-
359
-
360
-
361
-
362
-
363
-
364
-
365
-
366
-
367
-
368
-
369
-
370
-
371
-
372
-
373
-
374
-
375
-
376
-
377
-
378
-
379
-
380
-
381
-
382
-
383
-
384
-
385
-
386
-
387
-
388
-
389
-
390
-
391
-
392
-
393
-
394
-
395
-
396
-
397
-
398
-
399
-
400
-
401
-
402
-
403
-
404
-
405
-
406
-
407
-
408
-
409
-
410
-
411
-
412
-
413
-
414
-
415
-
416
-
417
-
418
-
419
-
420
-
421
-
422
-
423
-
424
-
425
-
426
-
427
-
428
-
429
-
430
-
431
-
432
-
433
-
434
-
435
-
436
-
437
-
438
-
439
-
440
-
441
-
442
-
443
-
444
-
445
-
446
-
447
-
448
-
449
-
450
-
451
-
452
-
453
-
454
-
455
-
456
-
457
-
458
-
459
-
460
-
461
-
462
-
463
-
464
-
465
-
466
-
467
-
468
-
469
-
470
-
471
-
472
-
473
-
474
-
475
-
476
 |
 |

HSBC HOLDINGS PLC
Report of the Directors: The Management of Risk (continued)
Liquidity and funding > Primary sources of funding / HSBC Holdings
246
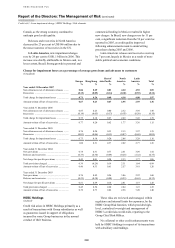
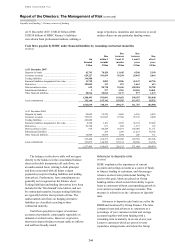
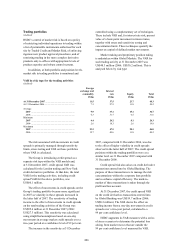
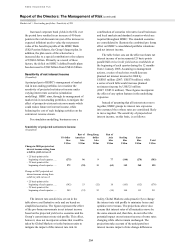
Ratio of net liquid assets to customer liabilities and net liquid assets
(Audited)
Year ended 31 December
2007
Year ended 31 December
2006
Ratio
Net liquid
assets Ratio
Net liquid
assets
% US$bn % US$bn
HSBC Bank (UK operations)
Year-end .............................................................................................. 12.1 44.2 16.3 48.7
Maximum ........................................................................................... 21.5 80.6 19.1 50.1
Minimum ............................................................................................ 12.1 39.9 12.8 32.9
Average ............................................................................................... 15.6 52.4 15.1 40.1
The Hongkong and Shanghai Banking Corporation
Year-end .............................................................................................. 21.8 53.9 21.4 46.7
Maximum ........................................................................................... 24.1 56.9 21.4 46.7
Minimum ............................................................................................ 16.1 35.3 14.2 28.4
Average ............................................................................................... 20.8 48.2 17.5 36.1
HSBC Bank USA
Year-end .............................................................................................. 15.8 17.1 22.7 22.5
Maximum ........................................................................................... 25.7 26.1 25.5 25.5
Minimum ............................................................................................ 15.8 17.1 19.1 17.8
Average ............................................................................................... 21.3 22.0 23.7 23.1
Total of Group’s other principal banking entities
Year-end .............................................................................................. 21.0 66.1 24.5 59.4
Maximum ........................................................................................... 26.1 72.7 25.6 61.3
Minimum ............................................................................................ 21.0 58.8 20.8 43.9
Average ............................................................................................... 24.0 65.3 22.9 51.7
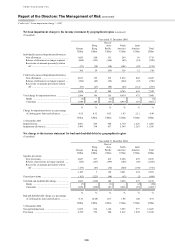
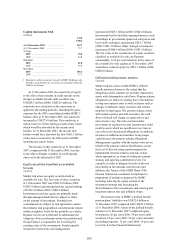
The ‘Total of Group’s other principal banking
entities’ reflects the other main banking subsidiaries
and, as such, includes businesses spread across a
range of locations, in many of which the Group may
require a higher ratio of net liquid assets to customer
liabilities to reflect local market conditions.
Projected cash flow scenario analysis
(Audited)
The Group uses a number of standard projected cash
flow scenarios which are designed to model both
Group-specific and market-wide liquidity crises.
The scenarios vary the rate and timing of deposit
withdrawals and drawdowns on committed lending
facilities, and restrict access to interbank funding,
term debt markets and the ability to generate funds
from asset portfolios. The scenarios are modelled by
all Group banking entities and by HSBC Finance.
The assumptions for each scenario are regularly
reviewed for appropriateness. In addition to the
Group’s standard projected cash flow scenarios,
individual entities are required to design their own
scenarios tailored to reflect specific local market
conditions, products and funding bases.
Limits for cumulative net cash flows under
stress scenarios are set for each banking entity and
for HSBC Finance.
Both ratio and cash flow limits reflect the local
market place, the diversity of funding sources
available and the concentration risk from large
depositors. Compliance with entity level limits is
monitored centrally by Group Finance and reported
regularly to the RMM.
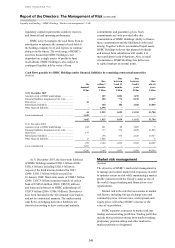
HSBC Finance
As HSBC Finance does not accept customer
deposits, it takes funding from the professional
markets. HSBC Finance uses a range of measures to
monitor funding risk, including projected cash flow
scenario analysis and placing caps on the amount of
unsecured term funding that can mature in any
rolling three-month and rolling 12-month periods.
HSBC Finance also maintains access to committed
sources of secured funding and has in place
committed backstop lines for short-term refinancing
CP programmes. At 31 December 2007, the
maximum amounts of unsecured term funding
maturing in any rolling three-month and rolling
12-month periods were US$6.2 billion and
US$17.7 billion, respectively (2006: US$6.1 billion
and US$16.0 billion). At 31 December 2007, HSBC
Finance also had in place unused committed sources
of secured funding, for which eligible assets were
held, of US$6.2 billion (2006: US$9.0 billion) and
committed backstop lines from non-Group entities in
support of CP programmes totalling US$9.3 billion
(2006: US$9.3 billion).