HSBC 2007 Annual Report Download - page 109
Download and view the complete annual report
Please find page 109 of the 2007 HSBC annual report below. You can navigate through the pages in the report by either clicking on the pages listed below, or by using the keyword search tool below to find specific information within the annual report.-
 1
1 -
2
-
3
-
4
-
5
-
6
-
7
-
8
-
9
-
10
-
11
-
12
-
13
-
14
-
15
-
16
-
17
-
18
-
19
-
20
-
21
-
22
-
23
-
24
-
25
-
26
-
27
-
28
-
29
-
30
-
31
-
32
-
33
-
34
-
35
-
36
-
37
-
38
-
39
-
40
-
41
-
42
-
43
-
44
-
45
-
46
-
47
-
48
-
49
-
50
-
51
-
52
-
53
-
54
-
55
-
56
-
57
-
58
-
59
-
60
-
61
-
62
-
63
-
64
-
65
-
66
-
67
-
68
-
69
-
70
-
71
-
72
-
73
-
74
-
75
-
76
-
77
-
78
-
79
-
80
-
81
-
82
-
83
-
84
-
85
-
86
-
87
-
88
-
89
-
90
-
91
-
92
-
93
-
94
-
95
-
96
-
97
-
98
-
 99
99 -
 100
100 -
 101
101 -
 102
102 -
 103
103 -
 104
104 -
 105
105 -
 106
106 -
 107
107 -
 108
108 -
 109
109 -
 110
110 -
 111
111 -
 112
112 -
 113
113 -
 114
114 -
 115
115 -
 116
116 -
 117
117 -
 118
118 -
 119
119 -
120
-
121
-
122
-
123
-
124
-
125
-
126
-
127
-
128
-
129
-
130
-
131
-
132
-
133
-
134
-
135
-
136
-
137
-
138
-
139
-
140
-
141
-
142
-
143
-
144
-
145
-
146
-
147
-
148
-
149
-
150
-
151
-
152
-
153
-
154
-
155
-
156
-
157
-
158
-
159
-
160
-
161
-
162
-
163
-
164
-
165
-
166
-
167
-
168
-
169
-
170
-
171
-
172
-
173
-
174
-
175
-
176
-
177
-
178
-
179
-
180
-
181
-
182
-
183
-
184
-
185
-
186
-
187
-
188
-
189
-
190
-
191
-
192
-
193
-
194
-
195
-
196
-
197
-
198
-
199
-
200
-
201
-
202
-
203
-
204
-
205
-
206
-
207
-
208
-
209
-
210
-
211
-
212
-
213
-
214
-
215
-
216
-
217
-
218
-
219
-
220
-
221
-
222
-
223
-
224
-
225
-
226
-
227
-
228
-
229
-
230
-
231
-
232
-
233
-
234
-
235
-
236
-
237
-
238
-
239
-
240
-
241
-
242
-
243
-
244
-
245
-
246
-
247
-
248
-
249
-
250
-
251
-
252
-
253
-
254
-
255
-
256
-
257
-
258
-
259
-
260
-
261
-
262
-
263
-
264
-
265
-
266
-
267
-
268
-
269
-
270
-
271
-
272
-
273
-
274
-
275
-
276
-
277
-
278
-
279
-
280
-
281
-
282
-
283
-
284
-
285
-
286
-
287
-
288
-
289
-
290
-
291
-
292
-
293
-
294
-
295
-
296
-
297
-
298
-
299
-
300
-
301
-
302
-
303
-
304
-
305
-
306
-
307
-
308
-
309
-
310
-
311
-
312
-
313
-
314
-
315
-
316
-
317
-
318
-
319
-
320
-
321
-
322
-
323
-
324
-
325
-
326
-
327
-
328
-
329
-
330
-
331
-
332
-
333
-
334
-
335
-
336
-
337
-
338
-
339
-
340
-
341
-
342
-
343
-
344
-
345
-
346
-
347
-
348
-
349
-
350
-
351
-
352
-
353
-
354
-
355
-
356
-
357
-
358
-
359
-
360
-
361
-
362
-
363
-
364
-
365
-
366
-
367
-
368
-
369
-
370
-
371
-
372
-
373
-
374
-
375
-
376
-
377
-
378
-
379
-
380
-
381
-
382
-
383
-
384
-
385
-
386
-
387
-
388
-
389
-
390
-
391
-
392
-
393
-
394
-
395
-
396
-
397
-
398
-
399
-
400
-
401
-
402
-
403
-
404
-
405
-
406
-
407
-
408
-
409
-
410
-
411
-
412
-
413
-
414
-
415
-
416
-
417
-
418
-
419
-
420
-
421
-
422
-
423
-
424
-
425
-
426
-
427
-
428
-
429
-
430
-
431
-
432
-
433
-
434
-
435
-
436
-
437
-
438
-
439
-
440
-
441
-
442
-
443
-
444
-
445
-
446
-
447
-
448
-
449
-
450
-
451
-
452
-
453
-
454
-
455
-
456
-
457
-
458
-
459
-
460
-
461
-
462
-
463
-
464
-
465
-
466
-
467
-
468
-
469
-
470
-
471
-
472
-
473
-
474
-
475
-
476
 |
 |

107
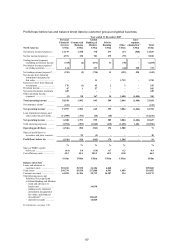
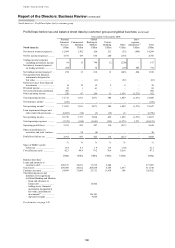
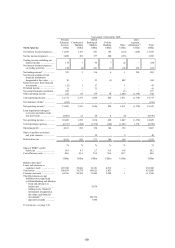
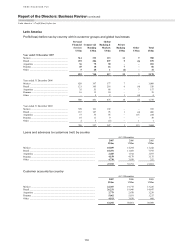
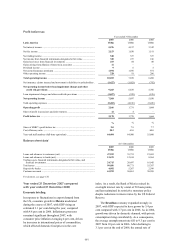
Profit/(loss) before tax and balance sheet data by customer group and global business
Year ended 31 December 2007
North America
Personal
Financial
Services
US$m
Commercial
Banking
US$m
Global
Banking &
Markets
US$m
Private
Banking
US$m
Other
US$m
Inter-
segment
elimination14
US$m
Total
US$m
Net interest income/(expense) .... 13,175 1,558 378 273 (17) (520) 14,847
Net fee income/(expense) ........... 4,571 338 701 279 (79) – 5,810
Trading income/(expense)
excluding net interest income (349) (2) (871) 11 (78) – (1,289)
Net interest income/(expense)
on trading activities ................ 134 – 137 –(44) 520 747
Net trading income/(expense)5 ... (215) (2) (734) 11 (122) 520 (542)
Net income from financial
instruments designated at
fair value ................................. – – 11 – 1,739
– 1,750
Gains less losses from financial
investments ............................. 176 (1) 65 2 3 – 245
Dividend income ......................... 47 1 57 – – – 105
Net earned insurance premiums . 449 – – – – – 449
Other operating income/
(expense) ................................
(5) 88 167 34
1,480
(1,404) 360
Total operating income ............ 18,198 1,982 645 599 3,004 (1,404) 23,024
Net insurance claims6 ................. (241) – – – –
– (241)
Net operating income4 .............. 17,957 1,982 645 599 3,004 (1,404) 22,783
Loan impairment charges and
other credit risk provisions ..... (11,909) (191) (46) (10) – – (12,156)
Net operating income ............... 6,048 1,791 599 589 3,004 (1,404) 10,627
Total operating expenses ............ (7,594) (893) (1,562) (415) (1,496) 1,404 (10,556)
Operating profit/(loss) .............. (1,546) 898 (963) 174 1,508 – 71
Share of profit/(loss) in
associates and joint ventures .. – 22 (2) – – – 20
Profit/(loss) before tax .............. (1,546) 920 (965) 174 1,508 – 91
% % % % % %
Share of HSBC’s profit
before tax ................................ (6.4) 3.8 (4.0) 0.7 6.3 0.4
Cost efficiency ratio ................... 42.3 45.1 242.2 69.3 49.8 46.3
US$m US$m US$m US$m US$m US$m
Balance sheet data7
Loans and advances to
customers (net) ....................... 218,676 38,930 26,186 6,068 – 289,860
Total assets ................................. 240,734 43,920 217,808 6,541 1,089 510,092
Customer accounts ...................... 61,824 36,306 30,732 16,187 124 145,173
The following assets and
liabilities were significant
to Global Banking and Markets:
– loans and advances to
banks (net) .......................... 14,938
– trading assets, financial
instruments designated at
fair value, and financial
investments16 ...................... 126,669
– deposits by banks ............... 14,825
For footnotes, see page 130.