HSBC 2007 Annual Report Download - page 150
Download and view the complete annual report
Please find page 150 of the 2007 HSBC annual report below. You can navigate through the pages in the report by either clicking on the pages listed below, or by using the keyword search tool below to find specific information within the annual report.-
 1
1 -
2
-
3
-
4
-
5
-
6
-
7
-
8
-
9
-
10
-
11
-
12
-
13
-
14
-
15
-
16
-
17
-
18
-
19
-
20
-
21
-
22
-
23
-
24
-
25
-
26
-
27
-
28
-
29
-
30
-
31
-
32
-
33
-
34
-
35
-
36
-
37
-
38
-
39
-
40
-
41
-
42
-
43
-
44
-
45
-
46
-
47
-
48
-
49
-
50
-
51
-
52
-
53
-
54
-
55
-
56
-
57
-
58
-
59
-
60
-
61
-
62
-
63
-
64
-
65
-
66
-
67
-
68
-
69
-
70
-
71
-
72
-
73
-
74
-
75
-
76
-
77
-
78
-
79
-
80
-
81
-
82
-
83
-
84
-
85
-
86
-
87
-
88
-
89
-
90
-
91
-
92
-
93
-
94
-
95
-
96
-
97
-
98
-
99
-
100
-
101
-
102
-
103
-
104
-
105
-
106
-
107
-
108
-
109
-
110
-
111
-
112
-
113
-
114
-
115
-
116
-
117
-
118
-
119
-
120
-
121
-
122
-
123
-
124
-
125
-
126
-
127
-
128
-
129
-
130
-
131
-
132
-
133
-
134
-
135
-
136
-
137
-
138
-
139
-
 140
140 -
 141
141 -
 142
142 -
 143
143 -
 144
144 -
 145
145 -
 146
146 -
 147
147 -
 148
148 -
 149
149 -
 150
150 -
 151
151 -
 152
152 -
 153
153 -
 154
154 -
 155
155 -
 156
156 -
 157
157 -
 158
158 -
 159
159 -
 160
160 -
161
-
162
-
163
-
164
-
165
-
166
-
167
-
168
-
169
-
170
-
171
-
172
-
173
-
174
-
175
-
176
-
177
-
178
-
179
-
180
-
181
-
182
-
183
-
184
-
185
-
186
-
187
-
188
-
189
-
190
-
191
-
192
-
193
-
194
-
195
-
196
-
197
-
198
-
199
-
200
-
201
-
202
-
203
-
204
-
205
-
206
-
207
-
208
-
209
-
210
-
211
-
212
-
213
-
214
-
215
-
216
-
217
-
218
-
219
-
220
-
221
-
222
-
223
-
224
-
225
-
226
-
227
-
228
-
229
-
230
-
231
-
232
-
233
-
234
-
235
-
236
-
237
-
238
-
239
-
240
-
241
-
242
-
243
-
244
-
245
-
246
-
247
-
248
-
249
-
250
-
251
-
252
-
253
-
254
-
255
-
256
-
257
-
258
-
259
-
260
-
261
-
262
-
263
-
264
-
265
-
266
-
267
-
268
-
269
-
270
-
271
-
272
-
273
-
274
-
275
-
276
-
277
-
278
-
279
-
280
-
281
-
282
-
283
-
284
-
285
-
286
-
287
-
288
-
289
-
290
-
291
-
292
-
293
-
294
-
295
-
296
-
297
-
298
-
299
-
300
-
301
-
302
-
303
-
304
-
305
-
306
-
307
-
308
-
309
-
310
-
311
-
312
-
313
-
314
-
315
-
316
-
317
-
318
-
319
-
320
-
321
-
322
-
323
-
324
-
325
-
326
-
327
-
328
-
329
-
330
-
331
-
332
-
333
-
334
-
335
-
336
-
337
-
338
-
339
-
340
-
341
-
342
-
343
-
344
-
345
-
346
-
347
-
348
-
349
-
350
-
351
-
352
-
353
-
354
-
355
-
356
-
357
-
358
-
359
-
360
-
361
-
362
-
363
-
364
-
365
-
366
-
367
-
368
-
369
-
370
-
371
-
372
-
373
-
374
-
375
-
376
-
377
-
378
-
379
-
380
-
381
-
382
-
383
-
384
-
385
-
386
-
387
-
388
-
389
-
390
-
391
-
392
-
393
-
394
-
395
-
396
-
397
-
398
-
399
-
400
-
401
-
402
-
403
-
404
-
405
-
406
-
407
-
408
-
409
-
410
-
411
-
412
-
413
-
414
-
415
-
416
-
417
-
418
-
419
-
420
-
421
-
422
-
423
-
424
-
425
-
426
-
427
-
428
-
429
-
430
-
431
-
432
-
433
-
434
-
435
-
436
-
437
-
438
-
439
-
440
-
441
-
442
-
443
-
444
-
445
-
446
-
447
-
448
-
449
-
450
-
451
-
452
-
453
-
454
-
455
-
456
-
457
-
458
-
459
-
460
-
461
-
462
-
463
-
464
-
465
-
466
-
467
-
468
-
469
-
470
-
471
-
472
-
473
-
474
-
475
-
476
 |
 |

HSBC HOLDINGS PLC
Report of the Directors: Financial Review (continued)
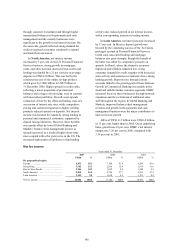
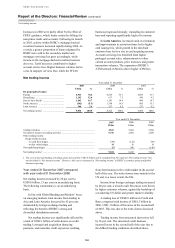
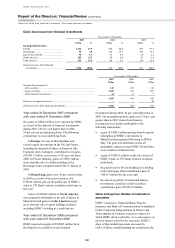
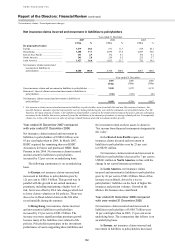
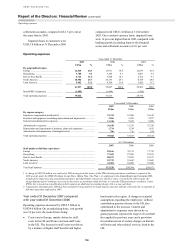
Gains less losses from financial investments / Net earned insurance premiums
148
Gains less losses from financial investments
Year ended 31 December
2007 2006 2005
US$m % US$m % US$m %
By geographical region
Europe ...................................................... 1,326 67.9 624 64.4 439 63.4
Hong Kong .............................................. 94 4.8 162 16.7 108 15.6
Rest of Asia-Pacific ................................. 38 1.9 41 4.2 18 2.6
North America ......................................... 245 12.5 58 6.0 47 6.8
Latin America .......................................... 253 12.9 84 8.7 80 11.6
Gains less losses from financial
investments .......................................... 1,956
100.0
969
100.0 692 100.0
Year ended 31 December
2007
US$m
2006
US$m
2005
US$m
Net gain from disposal of:
– debt securities ............................................................................................... 120 252 138
– equity securities ............................................................................................ 1,822 702 505
– other financial investments ........................................................................... 14 15 7
1,956 969 650
Recovery of impairment losses ....................................................................... – – 42
Gains less losses from financial investments .................................................. 1,956 969 692
Year ended 31 December 2007 compared
with year ended 31 December 2006
Net gains of US$2.0 billion were reported by HSBC
as a result of the disposal of financial investments
during 2007, 102 per cent higher than in 2006,
93 per cent on an underlying basis. The following
commentary is on an underlying basis.
In Europe, the sale of shareholdings and
various equity investments in the UK and France,
including the disposal of shares in Euronext (the
European stock exchange), contributed to net gains
of US$1.3 billion, an increase of 101 per cent from
2006. In Private Banking, gains of US$91 million
arose from the sale of a further holding in the
Hermitage Fund, compared with US$117 million in
2006.
In Hong Kong, gains were 42 per cent less than
in 2006 as a result of the non-recurrence of a
US$101 million gain on the partial sale of HSBC’s
stake in UTI Bank Limited, an Indian retail bank, in
that year.
Gains of US$245 million in North America
were primarily attributable to the sale of shares in
MasterCard and gains in Latin America largely
arose from the sale of equity holdings in Brazil,
including HSBC’s holding in a credit bureau.
Year ended 31 December 2006 compared
with year ended 31 December 2005
HSBC reported net gains of US$969 million from
the disposal of available-for-sale financial
investments during 2006, 40 per cent higher than in
2005. On an underlying basis, gains were 35 per cent
greater than in 2005. Gains from financial
investments were mainly attributable to the
following transactions:
• a gain of US$93 million arising from the partial
redemption of HSBC’s investment in
MasterCard Incorporated following its IPO in
May. The gain was distributed across all
geographic regions as most HSBC Group banks
were members of MasterCard;
• a gain of US$101 million on the sale of part of
HSBC’s stake in UTI Bank Limited, an Indian
retail bank;
• the partial sale by Private Banking of a holding
in the Hermitage Fund contributed a gain of
US$117 million for the year; and
• the sale of a portfolio of structured finance
investments, classified as debt securities,
contributed a gain of US$112 million.
Gains arising from dilution of interests in
associates
HSBC’s associates, Industrial Bank, Ping An
Insurance and Bank of Communications in mainland
China; Financiera Independencia in Mexico and
Techcombank in Vietnam, issued new shares for
which HSBC did not subscribe. As a consequence of
the new monies raised by the associates, HSBC’s
share of their underlying assets increased by
US$1.1 billion, notwithstanding the reduction in the