HSBC 2007 Annual Report Download - page 62
Download and view the complete annual report
Please find page 62 of the 2007 HSBC annual report below. You can navigate through the pages in the report by either clicking on the pages listed below, or by using the keyword search tool below to find specific information within the annual report.-
 1
1 -
 2
2 -
 3
3 -
 4
4 -
 5
5 -
 6
6 -
 7
7 -
 8
8 -
 9
9 -
 10
10 -
 11
11 -
 12
12 -
 13
13 -
 14
14 -
 15
15 -
 16
16 -
 17
17 -
 18
18 -
 19
19 -
 20
20 -
 21
21 -
 22
22 -
 23
23 -
 24
24 -
 25
25 -
 26
26 -
 27
27 -
 28
28 -
 29
29 -
 30
30 -
 31
31 -
 32
32 -
 33
33 -
 34
34 -
 35
35 -
 36
36 -
 37
37 -
 38
38 -
 39
39 -
 40
40 -
 41
41 -
 42
42 -
 43
43 -
 44
44 -
 45
45 -
 46
46 -
 47
47 -
 48
48 -
 49
49 -
 50
50 -
 51
51 -
 52
52 -
 53
53 -
 54
54 -
 55
55 -
 56
56 -
 57
57 -
 58
58 -
 59
59 -
 60
60 -
 61
61 -
 62
62 -
 63
63 -
 64
64 -
 65
65 -
 66
66 -
 67
67 -
 68
68 -
 69
69 -
 70
70 -
 71
71 -
 72
72 -
 73
73 -
 74
74 -
 75
75 -
 76
76 -
 77
77 -
 78
78 -
 79
79 -
 80
80 -
 81
81 -
 82
82 -
 83
83 -
 84
84 -
 85
85 -
 86
86 -
 87
87 -
 88
88 -
 89
89 -
 90
90 -
 91
91 -
 92
92 -
 93
93 -
 94
94 -
 95
95 -
 96
96 -
 97
97 -
 98
98 -
 99
99 -
 100
100 -
 101
101 -
 102
102 -
 103
103 -
 104
104 -
 105
105 -
 106
106 -
 107
107 -
 108
108 -
 109
109 -
 110
110 -
 111
111 -
 112
112 -
 113
113 -
 114
114 -
 115
115 -
 116
116 -
 117
117 -
 118
118 -
 119
119 -
 120
120 -
 121
121 -
 122
122 -
 123
123 -
 124
124 -
 125
125 -
 126
126 -
 127
127 -
 128
128 -
 129
129 -
 130
130 -
 131
131 -
 132
132 -
 133
133 -
 134
134 -
 135
135 -
 136
136 -
 137
137 -
 138
138 -
 139
139 -
 140
140 -
 141
141 -
 142
142 -
 143
143 -
 144
144 -
 145
145 -
 146
146 -
 147
147 -
 148
148 -
 149
149 -
 150
150 -
 151
151 -
 152
152 -
 153
153 -
 154
154 -
 155
155 -
 156
156 -
 157
157 -
 158
158 -
 159
159 -
 160
160 -
 161
161 -
 162
162 -
 163
163 -
 164
164 -
 165
165 -
 166
166 -
 167
167 -
 168
168 -
 169
169 -
 170
170 -
 171
171 -
 172
172 -
 173
173 -
 174
174 -
 175
175 -
 176
176 -
 177
177 -
 178
178 -
 179
179 -
 180
180 -
 181
181 -
 182
182 -
 183
183 -
 184
184 -
 185
185 -
 186
186 -
 187
187 -
 188
188 -
 189
189 -
 190
190 -
 191
191 -
 192
192 -
 193
193 -
 194
194 -
 195
195 -
 196
196 -
 197
197 -
 198
198 -
 199
199 -
 200
200 -
 201
201 -
 202
202 -
 203
203 -
 204
204 -
 205
205 -
 206
206 -
 207
207 -
 208
208 -
 209
209 -
 210
210 -
 211
211 -
 212
212 -
 213
213 -
 214
214 -
 215
215 -
 216
216 -
 217
217 -
 218
218 -
 219
219 -
 220
220 -
 221
221 -
 222
222 -
 223
223 -
 224
224 -
 225
225 -
 226
226 -
 227
227 -
 228
228 -
 229
229 -
 230
230 -
 231
231 -
 232
232 -
 233
233 -
 234
234 -
 235
235 -
 236
236 -
 237
237 -
 238
238 -
 239
239 -
 240
240 -
 241
241 -
 242
242 -
 243
243 -
 244
244 -
 245
245 -
 246
246 -
 247
247 -
 248
248 -
 249
249 -
 250
250 -
 251
251 -
 252
252 -
 253
253 -
 254
254 -
 255
255 -
 256
256 -
 257
257 -
 258
258 -
 259
259 -
 260
260 -
 261
261 -
 262
262 -
 263
263 -
 264
264 -
 265
265 -
 266
266 -
 267
267 -
 268
268 -
 269
269 -
 270
270 -
 271
271 -
 272
272 -
 273
273 -
 274
274 -
 275
275 -
 276
276 -
 277
277 -
 278
278 -
 279
279 -
 280
280 -
 281
281 -
 282
282 -
 283
283 -
 284
284 -
 285
285 -
 286
286 -
 287
287 -
 288
288 -
 289
289 -
 290
290 -
 291
291 -
 292
292 -
 293
293 -
 294
294 -
 295
295 -
 296
296 -
 297
297 -
 298
298 -
 299
299 -
 300
300 -
 301
301 -
 302
302 -
 303
303 -
 304
304 -
 305
305 -
 306
306 -
 307
307 -
 308
308 -
 309
309 -
 310
310 -
 311
311 -
 312
312 -
 313
313 -
 314
314 -
 315
315 -
 316
316 -
 317
317 -
 318
318 -
 319
319 -
 320
320 -
 321
321 -
 322
322 -
 323
323 -
 324
324 -
 325
325 -
 326
326 -
 327
327 -
 328
328 -
 329
329 -
 330
330 -
 331
331 -
 332
332 -
 333
333 -
 334
334 -
 335
335 -
 336
336 -
 337
337 -
 338
338 -
 339
339 -
 340
340 -
 341
341 -
 342
342 -
 343
343 -
 344
344 -
 345
345 -
 346
346 -
 347
347 -
 348
348 -
 349
349 -
 350
350 -
 351
351 -
 352
352 -
 353
353 -
 354
354 -
 355
355 -
 356
356 -
 357
357 -
 358
358 -
 359
359 -
 360
360 -
 361
361 -
 362
362 -
 363
363 -
 364
364 -
 365
365 -
 366
366 -
 367
367 -
 368
368 -
 369
369 -
 370
370 -
 371
371 -
 372
372 -
 373
373 -
 374
374 -
 375
375 -
 376
376 -
 377
377 -
 378
378 -
 379
379 -
 380
380 -
 381
381 -
 382
382 -
 383
383 -
 384
384 -
 385
385 -
 386
386 -
 387
387 -
 388
388 -
 389
389 -
 390
390 -
 391
391 -
 392
392 -
 393
393 -
 394
394 -
 395
395 -
 396
396 -
 397
397 -
 398
398 -
 399
399 -
 400
400 -
 401
401 -
 402
402 -
 403
403 -
 404
404 -
 405
405 -
 406
406 -
 407
407 -
 408
408 -
 409
409 -
 410
410 -
 411
411 -
 412
412 -
 413
413 -
 414
414 -
 415
415 -
 416
416 -
 417
417 -
 418
418 -
 419
419 -
 420
420 -
 421
421 -
 422
422 -
 423
423 -
 424
424 -
 425
425 -
 426
426 -
 427
427 -
 428
428 -
 429
429 -
 430
430 -
 431
431 -
 432
432 -
 433
433 -
 434
434 -
 435
435 -
 436
436 -
 437
437 -
 438
438 -
 439
439 -
 440
440 -
 441
441 -
 442
442 -
 443
443 -
 444
444 -
 445
445 -
 446
446 -
 447
447 -
 448
448 -
 449
449 -
 450
450 -
 451
451 -
 452
452 -
 453
453 -
 454
454 -
 455
455 -
 456
456 -
 457
457 -
 458
458 -
 459
459 -
 460
460 -
 461
461 -
 462
462 -
 463
463 -
 464
464 -
 465
465 -
 466
466 -
 467
467 -
 468
468 -
 469
469 -
 470
470 -
 471
471 -
 472
472 -
 473
473 -
 474
474 -
 475
475 -
 476
476
 |
 |

HSBC HOLDINGS PLC
Report of the Directors: Business Review (continued)
Hong Kong > 2007
60
Year ended 31 December 2007 compared
with year ended 31 December 2006
Economic briefing
Hong Kong’s economy remained robust during
2007, with the annual rate of growth of 6.3 per cent.
Domestic consumption was the major contributor to
economic expansion, supported by the strong labour
market. The unemployment rate fell to 3.4 per cent, a
nine year low, as the supply of labour remained very
tight. Global increases in food and oil prices affected
Hong Kong, but the territory also experienced wage
inflation, rising import prices and growth in property
rental costs. Inflation increased as a result, exceeding
3 per cent in the final quarter of the year.
In response to interest rate cuts in the US and
capital inflows into the local market, Hong Kong’s
main interest rate was cut on three separate
occasions during the final months of 2007, with the
prime rate ending the year at 6.75 per cent, down by
one per cent from its high for the year. Local asset
markets benefited accordingly. The previously very
strong levels of export growth slowed in the second
half of 2007, as demand from the US moderated and
the reduction in mainland China’s export tax rebate
in July temporarily affected Hong Kong’s re-exports.
Despite relatively modest trade growth, external
demand for Hong Kong’s services remained strong
due to the buoyant tourism sector and increasing
cross-border business activities, especially within the
financial sector.
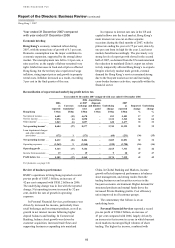
Reconciliation of reported and underlying profit before tax
Year ended 31 December 2007 compared with year ended 31 December 2006
Hong Kong
2006
as
reported
US$m
Currency
translation1
US$m
2006
at 2007
exchange
rates
US$m
Acquisitions,
disposals
and dilution
gains2
US$m
Underlying
change
US$m
2007
as
reported
US$m
Reported
change
%
Underlying
change
%
Net interest income .......... 4,685 (15) 4,670 – 813 5,483 17 17
Net fee income ................. 2,056 (6) 2,050 – 1,312 3,362 64 64
Other income3 .................. 1,863 (6) 1,857 – 620 2,477 33 33
Net operating income4 ... 8,604 (27) 8,577 – 2,745 11,322 32 32
Loan impairment charges
and other credit risk
provisions .................... (172) 1 (171) – (60) (231) (34) (35)
Net operating income .... 8,432 (26) 8,406 – 2,685 11,091 32 32
Operating expenses .......... (3,269) 9 (3,260) – (520) (3,780) (16) (16)
Operating profit ............. 5,163 (17) 5,146 – 2,165 7,311 42 42
Income from associates ... 19 - 19 – 9 28 47 47
Profit before tax ............. 5,182 (17) 5,165 – 2,174 7,339 42 42
For footnotes, see page 130.
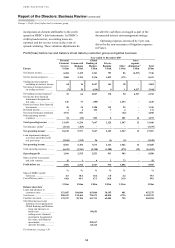
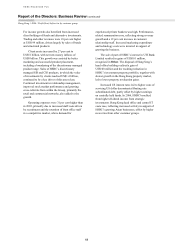
Review of business performance
HSBC’s operations in Hong Kong reported a record
pre-tax profit of US$7.3 billion, an increase of
42 per cent compared with US$5.2 billion in 2006.
The underlying change was in line with the reported
change. Net operating income increased by 32 per
cent, double the rate of growth in operating
expenses.
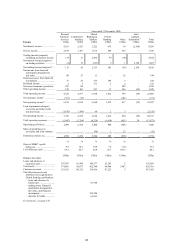
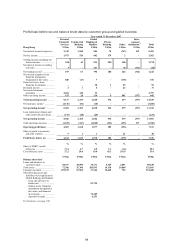
In Personal Financial Services, performance was
driven by increased fee income, particularly from
retail brokerage and investment products, as well as
growth in net interest income following higher
deposit balances and lending. In Commercial
Banking, balance sheet growth was driven by
customer acquisition, increased trade flows and
supporting businesses expanding into mainland
China. In Global Banking and Markets, income
growth reflected improved performance in balance
sheet management, and strong results from the
trading businesses and securities services in the
buoyant economic environment. Higher demand for
structured products and mutual funds drove the
increased Private Banking profits. Cost efficiency
ratios improved in all customer groups.
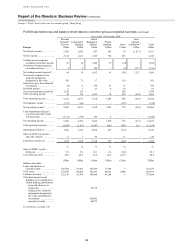
The commentary that follows is on an
underlying basis.
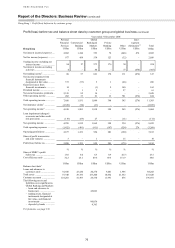
Personal Financial Services reported a record
pre-tax profit of US$4.2 billion, an increase of
47 per cent compared with 2006, largely driven by
an increase in fee income in a year in which buoyant
stock markets encouraged high volumes of share
trading. The higher fee income, combined with
