HSBC 2007 Annual Report Download - page 14
Download and view the complete annual report
Please find page 14 of the 2007 HSBC annual report below. You can navigate through the pages in the report by either clicking on the pages listed below, or by using the keyword search tool below to find specific information within the annual report.-
 1
1 -
2
-
3
-
 4
4 -
 5
5 -
 6
6 -
 7
7 -
 8
8 -
 9
9 -
 10
10 -
 11
11 -
 12
12 -
 13
13 -
 14
14 -
 15
15 -
 16
16 -
 17
17 -
 18
18 -
 19
19 -
 20
20 -
 21
21 -
 22
22 -
 23
23 -
 24
24 -
25
-
26
-
27
-
28
-
29
-
30
-
31
-
32
-
33
-
34
-
35
-
36
-
37
-
38
-
39
-
40
-
41
-
42
-
43
-
44
-
45
-
46
-
47
-
48
-
49
-
50
-
51
-
52
-
53
-
54
-
55
-
56
-
57
-
58
-
59
-
60
-
61
-
62
-
63
-
64
-
65
-
66
-
67
-
68
-
69
-
70
-
71
-
72
-
73
-
74
-
75
-
76
-
77
-
78
-
79
-
80
-
81
-
82
-
83
-
84
-
85
-
86
-
87
-
88
-
89
-
90
-
91
-
92
-
93
-
94
-
95
-
96
-
97
-
98
-
99
-
100
-
101
-
102
-
103
-
104
-
105
-
106
-
107
-
108
-
109
-
110
-
111
-
112
-
113
-
114
-
115
-
116
-
117
-
118
-
119
-
120
-
121
-
122
-
123
-
124
-
125
-
126
-
127
-
128
-
129
-
130
-
131
-
132
-
133
-
134
-
135
-
136
-
137
-
138
-
139
-
140
-
141
-
142
-
143
-
144
-
145
-
146
-
147
-
148
-
149
-
150
-
151
-
152
-
153
-
154
-
155
-
156
-
157
-
158
-
159
-
160
-
161
-
162
-
163
-
164
-
165
-
166
-
167
-
168
-
169
-
170
-
171
-
172
-
173
-
174
-
175
-
176
-
177
-
178
-
179
-
180
-
181
-
182
-
183
-
184
-
185
-
186
-
187
-
188
-
189
-
190
-
191
-
192
-
193
-
194
-
195
-
196
-
197
-
198
-
199
-
200
-
201
-
202
-
203
-
204
-
205
-
206
-
207
-
208
-
209
-
210
-
211
-
212
-
213
-
214
-
215
-
216
-
217
-
218
-
219
-
220
-
221
-
222
-
223
-
224
-
225
-
226
-
227
-
228
-
229
-
230
-
231
-
232
-
233
-
234
-
235
-
236
-
237
-
238
-
239
-
240
-
241
-
242
-
243
-
244
-
245
-
246
-
247
-
248
-
249
-
250
-
251
-
252
-
253
-
254
-
255
-
256
-
257
-
258
-
259
-
260
-
261
-
262
-
263
-
264
-
265
-
266
-
267
-
268
-
269
-
270
-
271
-
272
-
273
-
274
-
275
-
276
-
277
-
278
-
279
-
280
-
281
-
282
-
283
-
284
-
285
-
286
-
287
-
288
-
289
-
290
-
291
-
292
-
293
-
294
-
295
-
296
-
297
-
298
-
299
-
300
-
301
-
302
-
303
-
304
-
305
-
306
-
307
-
308
-
309
-
310
-
311
-
312
-
313
-
314
-
315
-
316
-
317
-
318
-
319
-
320
-
321
-
322
-
323
-
324
-
325
-
326
-
327
-
328
-
329
-
330
-
331
-
332
-
333
-
334
-
335
-
336
-
337
-
338
-
339
-
340
-
341
-
342
-
343
-
344
-
345
-
346
-
347
-
348
-
349
-
350
-
351
-
352
-
353
-
354
-
355
-
356
-
357
-
358
-
359
-
360
-
361
-
362
-
363
-
364
-
365
-
366
-
367
-
368
-
369
-
370
-
371
-
372
-
373
-
374
-
375
-
376
-
377
-
378
-
379
-
380
-
381
-
382
-
383
-
384
-
385
-
386
-
387
-
388
-
389
-
390
-
391
-
392
-
393
-
394
-
395
-
396
-
397
-
398
-
399
-
400
-
401
-
402
-
403
-
404
-
405
-
406
-
407
-
408
-
409
-
410
-
411
-
412
-
413
-
414
-
415
-
416
-
417
-
418
-
419
-
420
-
421
-
422
-
423
-
424
-
425
-
426
-
427
-
428
-
429
-
430
-
431
-
432
-
433
-
434
-
435
-
436
-
437
-
438
-
439
-
440
-
441
-
442
-
443
-
444
-
445
-
446
-
447
-
448
-
449
-
450
-
451
-
452
-
453
-
454
-
455
-
456
-
457
-
458
-
459
-
460
-
461
-
462
-
463
-
464
-
465
-
466
-
467
-
468
-
469
-
470
-
471
-
472
-
473
-
474
-
475
-
476
 |
 |

HSBC HOLDINGS PLC
Report of the Directors: Business Review (continued)
KPIs
12
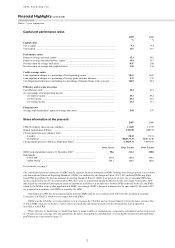
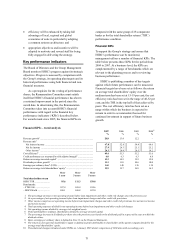
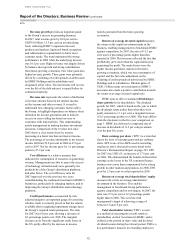
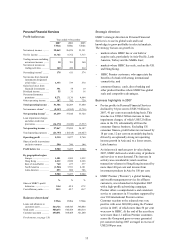
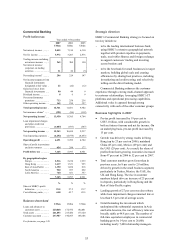
Revenue growth provides an important guide
to the Group’s success in generating business.
In 2007, total revenue grew by 20.8 per cent to
US$79.0 billion, 13.5 per cent on an underlying
basis, reflecting HSBC’s expansion into new
products and markets, improved brand recognition
and refinements in segmentation to better meet
customer needs. The trend maintained the strong
performance in 2006 when the underlying increase
was 10.5 per cent. Higher revenue was largely driven
by balance sheet growth and strong contributions
from faster-growing economies. Fair value gains also
helped revenue growth. These gains were primarily
driven by a widening of credit spreads on debt issued
by HSBC Holdings and its subsidiaries and
designated at fair value. The movements will reverse
over the life of the debt unless it is repaid before its
contractual maturity.
Revenue mix represents the relative distribution
of revenue streams between net interest income,
net fee income and other revenue. It is used to
understand how changing economic factors affect
the Group, to highlight dependence on balance sheet
utilisation for income generation and to indicate
success in cross-selling fee-based services to
customers with loan facilities. This understanding
assists management in making business investment
decisions. Comparison of the revenue mix since
2005 shows a clear trend of net fee income
increasing at a faster rate than net interest income.
The percentage of revenue attributable to net interest
income fell from 52.8 per cent in 2006 to 47.8 per
cent in 2007. Net fee income grew by 1.6 percentage
points to 27.9 per cent.
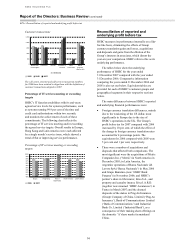
Cost efficiency is a relative measure that
indicates the consumption of resources in generating
revenue. Management uses this to assess the success
of technology utilisation and, more generally, the
productivity of the Group’s distribution platforms
and sales forces. The cost efficiency ratio for
2007 improved over the previous two years
notwithstanding the continued investment in HSBC’s
businesses, particularly in emerging markets, and in
improving the Group’s distribution and technology
platforms.
Credit performance as measured by risk-
adjusted margin is an important gauge for assessing
whether credit is correctly priced so that the returns
available after recognising impairment charges meet
the Group’s required return parameters. The ratio
for 2007 was 6.0 per cent, showing a decrease of
0.3 percentage points over 2006. The marginal
decrease arose from the significant credit losses in
the US, partly offset by the increase in income
mainly generated from the faster-growing
economies.
Return on average invested capital measures
the return on the capital investment made in the
business, enabling management to benchmark HSBC
against competitors. In 2007, the ratio of 15.3 per
cent was 0.4 percentage points higher than that
reported in 2006. This increase reflected the fact that
profitability grew faster than the capital utilised in
generating the profit. The main drivers were the
higher income generated, mainly in the faster-
growing economies, which was not consumptive of
capital, and the fair value adjustment on the
widening of credit spreads on debt issued by HSBC
Holdings and its subsidiaries. Dilution gains of
US$1.1 billion made on investments in HSBC’s
associates also made a positive contribution towards
the return on average invested capital ratio.
HSBC aims to deliver sustained dividend per
share growth for its shareholders. The dividend
growth for 2007, which is based on the year to which
the dividends relate (rather than when they were
paid), amounts to 11.1 per cent, a marginal increase
of 0.1 percentage points over 2006. This basis differs
from the disclosure in the five-year comparison on
page 3. HSBC has delivered a compound rate of
increase in dividends of 11.2 per cent per annum
over the past five years.
Basic earnings per share (‘EPS’) is a ratio that
shows the level of earnings generated per ordinary
share. EPS is one of two KPIs used in rewarding
employees and is discussed in more detail in the
Director’s Remuneration Report on page 325. EPS
for 2007 was US$1.65, an increase of 17.9 per cent
on 2006. This demonstrated the benefit of diversified
earnings as the losses in the US consumer finance
business were more than compensated for by strong
growth in other markets and products. In 2006, EPS
grew by 2.9 per cent over that reported in 2005.
Return on average total shareholders’ equity
measures the return on average shareholders’
investment in the business. This enables
management to benchmark Group performance
against competitors and its own targets. In 2007, the
ratio was 15.9 per cent or 0.2 percentage points
higher than in 2006. This is in line with
management’s target of achieving a range of
between 15 and 19 per cent.
Total shareholder return (‘TSR’) is used
as a method of assessing the overall return to
shareholders on their investment in HSBC, and is
defined as the growth in share value and declared
dividend income during the relevant period. TSR is a
key performance measure in rewarding employees.