HSBC 2007 Annual Report Download - page 239
Download and view the complete annual report
Please find page 239 of the 2007 HSBC annual report below. You can navigate through the pages in the report by either clicking on the pages listed below, or by using the keyword search tool below to find specific information within the annual report.-
 1
1 -
2
-
3
-
4
-
5
-
6
-
7
-
8
-
9
-
10
-
11
-
12
-
13
-
14
-
15
-
16
-
17
-
18
-
19
-
20
-
21
-
22
-
23
-
24
-
25
-
26
-
27
-
28
-
29
-
30
-
31
-
32
-
33
-
34
-
35
-
36
-
37
-
38
-
39
-
40
-
41
-
42
-
43
-
44
-
45
-
46
-
47
-
48
-
49
-
50
-
51
-
52
-
53
-
54
-
55
-
56
-
57
-
58
-
59
-
60
-
61
-
62
-
63
-
64
-
65
-
66
-
67
-
68
-
69
-
70
-
71
-
72
-
73
-
74
-
75
-
76
-
77
-
78
-
79
-
80
-
81
-
82
-
83
-
84
-
85
-
86
-
87
-
88
-
89
-
90
-
91
-
92
-
93
-
94
-
95
-
96
-
97
-
98
-
99
-
100
-
101
-
102
-
103
-
104
-
105
-
106
-
107
-
108
-
109
-
110
-
111
-
112
-
113
-
114
-
115
-
116
-
117
-
118
-
119
-
120
-
121
-
122
-
123
-
124
-
125
-
126
-
127
-
128
-
129
-
130
-
131
-
132
-
133
-
134
-
135
-
136
-
137
-
138
-
139
-
140
-
141
-
142
-
143
-
144
-
145
-
146
-
147
-
148
-
149
-
150
-
151
-
152
-
153
-
154
-
155
-
156
-
157
-
158
-
159
-
160
-
161
-
162
-
163
-
164
-
165
-
166
-
167
-
168
-
169
-
170
-
171
-
172
-
173
-
174
-
175
-
176
-
177
-
178
-
179
-
180
-
181
-
182
-
183
-
184
-
185
-
186
-
187
-
188
-
189
-
190
-
191
-
192
-
193
-
194
-
195
-
196
-
197
-
198
-
199
-
200
-
201
-
202
-
203
-
204
-
205
-
206
-
207
-
208
-
209
-
210
-
211
-
212
-
213
-
214
-
215
-
216
-
217
-
218
-
219
-
220
-
221
-
222
-
223
-
224
-
225
-
226
-
227
-
228
-
 229
229 -
 230
230 -
 231
231 -
 232
232 -
 233
233 -
 234
234 -
 235
235 -
 236
236 -
 237
237 -
 238
238 -
 239
239 -
 240
240 -
 241
241 -
 242
242 -
 243
243 -
 244
244 -
 245
245 -
 246
246 -
 247
247 -
 248
248 -
 249
249 -
250
-
251
-
252
-
253
-
254
-
255
-
256
-
257
-
258
-
259
-
260
-
261
-
262
-
263
-
264
-
265
-
266
-
267
-
268
-
269
-
270
-
271
-
272
-
273
-
274
-
275
-
276
-
277
-
278
-
279
-
280
-
281
-
282
-
283
-
284
-
285
-
286
-
287
-
288
-
289
-
290
-
291
-
292
-
293
-
294
-
295
-
296
-
297
-
298
-
299
-
300
-
301
-
302
-
303
-
304
-
305
-
306
-
307
-
308
-
309
-
310
-
311
-
312
-
313
-
314
-
315
-
316
-
317
-
318
-
319
-
320
-
321
-
322
-
323
-
324
-
325
-
326
-
327
-
328
-
329
-
330
-
331
-
332
-
333
-
334
-
335
-
336
-
337
-
338
-
339
-
340
-
341
-
342
-
343
-
344
-
345
-
346
-
347
-
348
-
349
-
350
-
351
-
352
-
353
-
354
-
355
-
356
-
357
-
358
-
359
-
360
-
361
-
362
-
363
-
364
-
365
-
366
-
367
-
368
-
369
-
370
-
371
-
372
-
373
-
374
-
375
-
376
-
377
-
378
-
379
-
380
-
381
-
382
-
383
-
384
-
385
-
386
-
387
-
388
-
389
-
390
-
391
-
392
-
393
-
394
-
395
-
396
-
397
-
398
-
399
-
400
-
401
-
402
-
403
-
404
-
405
-
406
-
407
-
408
-
409
-
410
-
411
-
412
-
413
-
414
-
415
-
416
-
417
-
418
-
419
-
420
-
421
-
422
-
423
-
424
-
425
-
426
-
427
-
428
-
429
-
430
-
431
-
432
-
433
-
434
-
435
-
436
-
437
-
438
-
439
-
440
-
441
-
442
-
443
-
444
-
445
-
446
-
447
-
448
-
449
-
450
-
451
-
452
-
453
-
454
-
455
-
456
-
457
-
458
-
459
-
460
-
461
-
462
-
463
-
464
-
465
-
466
-
467
-
468
-
469
-
470
-
471
-
472
-
473
-
474
-
475
-
476
 |
 |

237
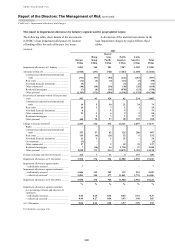
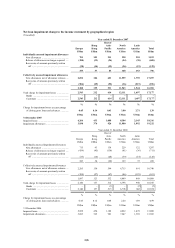
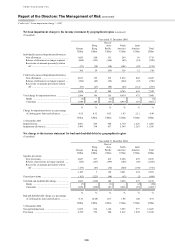
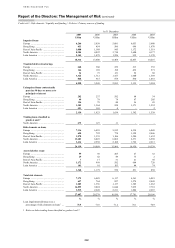
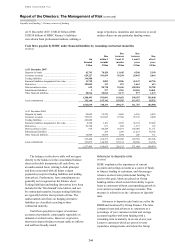
(Unaudited)
Year ended 31 December 2003
Europe
US$m
Hong Kong
US$m
Rest of
Asia-Pacific
US$m
North
America
US$m
Latin
America
US$m
Total
US$m
Specific provisions
New provisions ............................................... 1,485 655 412 4,907 318 7,777
Release of provisions no longer required ...... (351) (182) (269) (80) (71) (953)
Recoveries of amounts previously written
off ............................................................... (142) (42) (74) (329) (23) (610)
992 431 69 4,498 224 6,214
General provisions .............................................. (118) (31) 16 59 (47) (121)
Total bad and doubtful debt charge .................... 874 400 85 4,557 177 6,093
Banks ............................................................. (6) – 3 – – (3)
Customers ...................................................... 880 400 82 4,557 177 6,096
% % % % % %
Bad and doubtful debt charge as a percentage
of closing gross loans and advances .............. 0.41 0.53 0.17 2.33 0.79 1.12
US$m US$m US$m US$m US$m US$m
31 December 2003
Non-performing loans ........................................ 5,701 1,671 1,538 4,889 1,251 15,050
Provisions ........................................................... 4,415 1,055 1,177 5,665 1,379 13,691
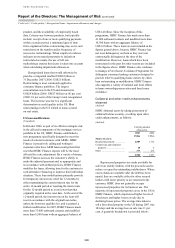
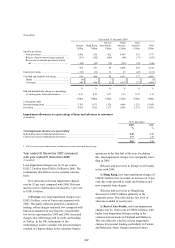
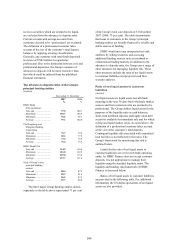
Impairment allowances as a percentage of loans and advances to customers
(Unaudited)
At 31 December
2007 2006
% %
Total impairment allowances to gross lending1
Individually assessed impairment allowances .................................................................................. 0.28 0.30
Collectively assessed impairment allowances .................................................................................. 1.73 1.28
2.01 1.58
1 Net of reverse repo transactions, settlement accounts and stock borrowings.
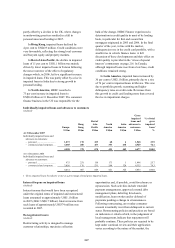
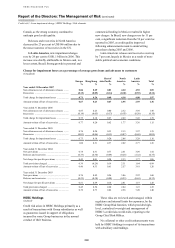
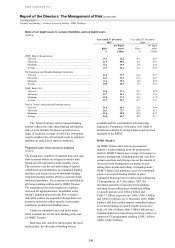
Year ended 31 December 2007 compared
with year ended 31 December 2006
(Unaudited)
Loan impairment charges rose by 63 per cent to
US$17.2 billion from US$10.5 billion in 2006. The
commentary that follows is on a constant currency
basis:
New allowances for loan impairment charges
rose by 52 per cent, compared with 2006. Releases
and recoveries of allowances increased by 1 per cent
to US$1.6 billion.
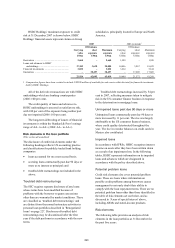
In Europe, new loan impairment charges were
US$3.5 billion, a rise of 8 per cent compared with
2006. This partly reflected growth in commercial
lending, where charges remained low compared with
historical amounts but rose from the exceptionally
low levels experienced in 2005 and 2006. Increased
charges also reflected growth in credit card lending
in Turkey. In the UK, refinements to the
methodology used to calculate roll rate percentages
resulted in a higher charge in the consumer finance
operations in the first half of the year. Excluding
this, loan impairment charges were marginally lower
than in 2006.
Releases and recoveries in Europe were broadly
in line with 2006.
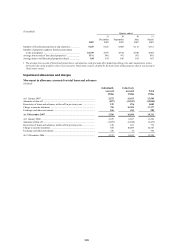
In Hong Kong, new loan impairment charges of
US$287 million were recorded, an increase of 19 per
cent, due to the growth in credit card balances and
new corporate loan charges.
Releases and recoveries in Hong Kong
decreased to US$75 million, primarily in the
corporate sector. This reflected the low level of
allowances added in recent years.
In Rest of Asia-Pacific, new loan impairment
charges rose by 10 per cent to US$834 million, with
higher loan impairment charges arising in the
commercial loan books in Thailand and Malaysia.
This was offset by a decline in loan impairment
charges for personal lending, particularly in Taiwan
and Indonesia, where charges returned to more