HSBC 2007 Annual Report Download - page 283
Download and view the complete annual report
Please find page 283 of the 2007 HSBC annual report below. You can navigate through the pages in the report by either clicking on the pages listed below, or by using the keyword search tool below to find specific information within the annual report.-
 1
1 -
2
-
3
-
4
-
5
-
6
-
7
-
8
-
9
-
10
-
11
-
12
-
13
-
14
-
15
-
16
-
17
-
18
-
19
-
20
-
21
-
22
-
23
-
24
-
25
-
26
-
27
-
28
-
29
-
30
-
31
-
32
-
33
-
34
-
35
-
36
-
37
-
38
-
39
-
40
-
41
-
42
-
43
-
44
-
45
-
46
-
47
-
48
-
49
-
50
-
51
-
52
-
53
-
54
-
55
-
56
-
57
-
58
-
59
-
60
-
61
-
62
-
63
-
64
-
65
-
66
-
67
-
68
-
69
-
70
-
71
-
72
-
73
-
74
-
75
-
76
-
77
-
78
-
79
-
80
-
81
-
82
-
83
-
84
-
85
-
86
-
87
-
88
-
89
-
90
-
91
-
92
-
93
-
94
-
95
-
96
-
97
-
98
-
99
-
100
-
101
-
102
-
103
-
104
-
105
-
106
-
107
-
108
-
109
-
110
-
111
-
112
-
113
-
114
-
115
-
116
-
117
-
118
-
119
-
120
-
121
-
122
-
123
-
124
-
125
-
126
-
127
-
128
-
129
-
130
-
131
-
132
-
133
-
134
-
135
-
136
-
137
-
138
-
139
-
140
-
141
-
142
-
143
-
144
-
145
-
146
-
147
-
148
-
149
-
150
-
151
-
152
-
153
-
154
-
155
-
156
-
157
-
158
-
159
-
160
-
161
-
162
-
163
-
164
-
165
-
166
-
167
-
168
-
169
-
170
-
171
-
172
-
173
-
174
-
175
-
176
-
177
-
178
-
179
-
180
-
181
-
182
-
183
-
184
-
185
-
186
-
187
-
188
-
189
-
190
-
191
-
192
-
193
-
194
-
195
-
196
-
197
-
198
-
199
-
200
-
201
-
202
-
203
-
204
-
205
-
206
-
207
-
208
-
209
-
210
-
211
-
212
-
213
-
214
-
215
-
216
-
217
-
218
-
219
-
220
-
221
-
222
-
223
-
224
-
225
-
226
-
227
-
228
-
229
-
230
-
231
-
232
-
233
-
234
-
235
-
236
-
237
-
238
-
239
-
240
-
241
-
242
-
243
-
244
-
245
-
246
-
247
-
248
-
249
-
250
-
251
-
252
-
253
-
254
-
255
-
256
-
257
-
258
-
259
-
260
-
261
-
262
-
263
-
264
-
265
-
266
-
267
-
268
-
269
-
270
-
271
-
272
-
 273
273 -
 274
274 -
 275
275 -
 276
276 -
 277
277 -
 278
278 -
 279
279 -
 280
280 -
 281
281 -
 282
282 -
 283
283 -
 284
284 -
 285
285 -
 286
286 -
 287
287 -
 288
288 -
 289
289 -
 290
290 -
 291
291 -
 292
292 -
 293
293 -
294
-
295
-
296
-
297
-
298
-
299
-
300
-
301
-
302
-
303
-
304
-
305
-
306
-
307
-
308
-
309
-
310
-
311
-
312
-
313
-
314
-
315
-
316
-
317
-
318
-
319
-
320
-
321
-
322
-
323
-
324
-
325
-
326
-
327
-
328
-
329
-
330
-
331
-
332
-
333
-
334
-
335
-
336
-
337
-
338
-
339
-
340
-
341
-
342
-
343
-
344
-
345
-
346
-
347
-
348
-
349
-
350
-
351
-
352
-
353
-
354
-
355
-
356
-
357
-
358
-
359
-
360
-
361
-
362
-
363
-
364
-
365
-
366
-
367
-
368
-
369
-
370
-
371
-
372
-
373
-
374
-
375
-
376
-
377
-
378
-
379
-
380
-
381
-
382
-
383
-
384
-
385
-
386
-
387
-
388
-
389
-
390
-
391
-
392
-
393
-
394
-
395
-
396
-
397
-
398
-
399
-
400
-
401
-
402
-
403
-
404
-
405
-
406
-
407
-
408
-
409
-
410
-
411
-
412
-
413
-
414
-
415
-
416
-
417
-
418
-
419
-
420
-
421
-
422
-
423
-
424
-
425
-
426
-
427
-
428
-
429
-
430
-
431
-
432
-
433
-
434
-
435
-
436
-
437
-
438
-
439
-
440
-
441
-
442
-
443
-
444
-
445
-
446
-
447
-
448
-
449
-
450
-
451
-
452
-
453
-
454
-
455
-
456
-
457
-
458
-
459
-
460
-
461
-
462
-
463
-
464
-
465
-
466
-
467
-
468
-
469
-
470
-
471
-
472
-
473
-
474
-
475
-
476
 |
 |

281
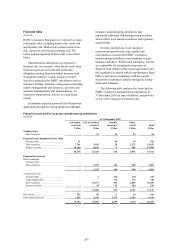
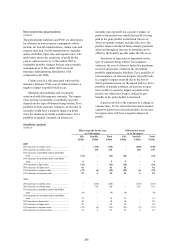
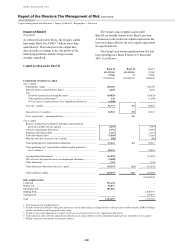
Non-economic assumptions
(Audited)
The policyholder liabilities and PVIF are determined
by reference to non-economic assumptions which
include, for non-life manufacturers, claims costs and
expense rates and, for life manufacturers, mortality
and/or morbidity, lapse rates and expense rates. The
table below shows the sensitivity of profit for the
year to, and net assets at, 31 December 2007 to
reasonably possible changes in these non-economic
assumptions at 31 December 2007 across all
insurance manufacturing subsidiaries, with
comparatives for 2006.
Claims costs is a risk associated with non-life
insurance business. If the cost of claims increases, a
negative impact on profit would occur.
Mortality and morbidity risk is typically
associated with life insurance contracts. The impact
of an increase in mortality or morbidity on profit
depends on the type of business being written. For a
portfolio of term assurance contracts, an increase in
mortality would have a negative impact on profit
since the instances of claims would increase. For a
portfolio of annuity contracts, an increase in
mortality rates typically has a positive impact on
profit as the period over which the benefit is being
paid to the policyholder is shortened. However,
where an annuity contract includes life cover, the
positive impact of reduced future annuity payments
observed through an increase in mortality can be
offset by the benefits payable under the life cover.
Sensitivity to lapse rates is dependent on the
type of contracts being written. For insurance
contracts, the cost of claims is funded by premiums
received and income earned on the investment
portfolio supporting the liabilities. For a portfolio of
term assurance, an increase in lapses typically leads
to a negative impact on profit due to the loss of
future premium income on the lapsed policies. For a
portfolio of annuity contracts, an increase in lapse
rates results in a positive impact on profit as the
period over which the Group is obliged to pay
benefits to the policyholder is shortened.
Expense rate risk is the exposure to a change in
expense rates. To the extent that increased expenses
cannot be passed on to the policyholder, an increase
in expense rates will have a negative impact on
profits.
Sensitivity analysis
(Audited)
Effect on profit for the year
to 31 December
Effect on net assets
at 31 December
Life Non-life Total Life Non-life Total
US$m US$m US$m US$m US$m US$m
2007
20% increase in claims costs .............................. – (138) (138) – (138) (138)
20% decrease in claims costs ............................. – 138 138 – 138 138
10% increase in mortality and/or morbidity
rates ................................................................. (21) – (21) (21) – (21)
10% decrease in mortality and/or morbidity
rates ................................................................. 9 – 9 9 – 9
50% increase in lapse rates ................................. (16) – (16) (16) – (16)
50% decrease in lapse rates ................................ 61 – 61 61 – 61
10% increase in expense rates ............................ (23) (6) (29) (23) (6) (29)
10% decrease in expense rates ........................... 23 6 29 23 6 29
2006
20% increase in claims costs .............................. – (118) (118) – (118) (118)
20% decrease in claims costs ............................. – 118 118 – 118 118
10% increase in mortality and/or morbidity
rates ................................................................. (8) – (8) (8) – (8)
10% decrease in mortality and/or morbidity
rates ................................................................. 15 – 15 15 – 15
50% increase in lapse rates ................................. 10 – 10 10 – 10
50% decrease in lapse rates ................................ 22 – 22 22 – 22
10% increase in expense rates ............................ (21) (2) (23) (21) (2) (23)
10% decrease in expense rates ........................... 21 2 23 21 2 23