Frontier Communications 2008 Annual Report Download - page 60
Download and view the complete annual report
Please find page 60 of the 2008 Frontier Communications annual report below. You can navigate through the pages in the report by either clicking on the pages listed below, or by using the keyword search tool below to find specific information within the annual report.-
 1
1 -
2
-
3
-
4
-
5
-
6
-
7
-
8
-
9
-
10
-
11
-
12
-
13
-
14
-
15
-
16
-
17
-
18
-
19
-
20
-
21
-
22
-
23
-
24
-
25
-
26
-
27
-
28
-
29
-
30
-
31
-
32
-
33
-
34
-
35
-
36
-
37
-
38
-
39
-
40
-
41
-
42
-
43
-
44
-
45
-
46
-
47
-
48
-
49
-
 50
50 -
 51
51 -
 52
52 -
 53
53 -
 54
54 -
 55
55 -
 56
56 -
 57
57 -
 58
58 -
 59
59 -
 60
60 -
 61
61 -
 62
62 -
 63
63 -
 64
64 -
 65
65 -
 66
66 -
 67
67 -
 68
68 -
 69
69 -
 70
70 -
71
-
72
-
73
-
74
-
75
-
76
-
77
-
78
-
79
-
80
-
81
-
82
-
83
-
84
-
85
-
86
-
87
-
88
-
89
-
90
-
91
-
92
-
93
-
94
-
95
-
96
-
97
-
98
-
99
 |
 |

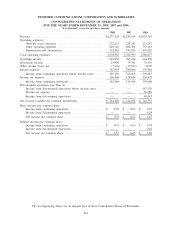
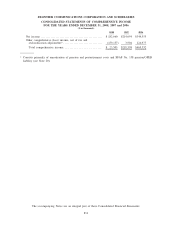
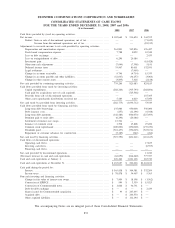
FRONTIER COMMUNICATIONS CORPORATION AND SUBSIDIARIES
CONSOLIDATED STATEMENTS OF CASH FLOWS
FOR THE YEARS ENDED DECEMBER 31, 2008, 2007 and 2006
($ in thousands) 2008 2007 2006
Cash flows provided by (used in) operating activities:
Net income . . . . . . . . . . . . . . . . . . . . . . . . . . . . . . . . . . . . . . . . . . . . . . . . . . . . . . . . . . . . . . . . . . . . . . . $ 182,660 $ 214,654 $ 344,555
Deduct: Gain on sale of discontinued operations, net of tax. . . . . . . . . . . . . . . . . . . . . — — (71,635)
Income from discontinued operations, net of tax. . . . . . . . . . . . . . . . . . . . . . . — — (18,912)
Adjustments to reconcile income to net cash provided by operating activities:
Depreciation and amortization expense. . . . . . . . . . . . . . . . . . . . . . . . . . . . . . . . . . . . . . . . . 561,801 545,856 476,487
Stock based compensation expense . . . . . . . . . . . . . . . . . . . . . . . . . . . . . . . . . . . . . . . . . . . . 7,788 9,022 10,340
Loss on debt exchange. . . . . . . . . . . . . . . . . . . . . . . . . . . . . . . . . . . . . . . . . . . . . . . . . . . . . . . . — — 2,433
Loss on extinguishment of debt . . . . . . . . . . . . . . . . . . . . . . . . . . . . . . . . . . . . . . . . . . . . . . . 6,290 20,186 —
Investment gain . . . . . . . . . . . . . . . . . . . . . . . . . . . . . . . . . . . . . . . . . . . . . . . . . . . . . . . . . . . . . . — — (61,428)
Other non-cash adjustments . . . . . . . . . . . . . . . . . . . . . . . . . . . . . . . . . . . . . . . . . . . . . . . . . . . (7,044) (7,598) 5,191
Deferred income taxes . . . . . . . . . . . . . . . . . . . . . . . . . . . . . . . . . . . . . . . . . . . . . . . . . . . . . . . . 33,967 81,011 132,031
Legal settlement . . . . . . . . . . . . . . . . . . . . . . . . . . . . . . . . . . . . . . . . . . . . . . . . . . . . . . . . . . . . . . — (7,905) —
Change in accounts receivable. . . . . . . . . . . . . . . . . . . . . . . . . . . . . . . . . . . . . . . . . . . . . . . . . 9,746 (4,714) 15,333
Change in accounts payable and other liabilities. . . . . . . . . . . . . . . . . . . . . . . . . . . . . . . . (52,047) (36,257) (3,064)
Change in other current assets. . . . . . . . . . . . . . . . . . . . . . . . . . . . . . . . . . . . . . . . . . . . . . . . . (3,895) 7,428 (2,148)
Net cash provided by continuing operating activities . . . . . . . . . . . . . . . . . . . . . . . . . . . . . . . . 739,266 821,683 829,183
Cash flows provided from (used by) investing activities:
Capital expenditures . . . . . . . . . . . . . . . . . . . . . . . . . . . . . . . . . . . . . . . . . . . . . . . . . . . . . . . . . . (288,264) (315,793) (268,806)
Cash paid for acquisitions (net of cash acquired) . . . . . . . . . . . . . . . . . . . . . . . . . . . . . . . — (725,548) —
Proceeds from sale of discontinued operations. . . . . . . . . . . . . . . . . . . . . . . . . . . . . . . . . . — — 255,305
Other assets (purchased) distributions received, net . . . . . . . . . . . . . . . . . . . . . . . . . . . . . 5,489 6,629 67,050
Net cash (used by) provided from investing activities . . . . . . . . . . . . . . . . . . . . . . . . . . . . . . . (282,775) (1,034,712) 53,549
Cash flows provided from (used by) financing activities:
Long-term debt borrowings. . . . . . . . . . . . . . . . . . . . . . . . . . . . . . . . . . . . . . . . . . . . . . . . . . . . 135,000 950,000 550,000
Debt issuance costs . . . . . . . . . . . . . . . . . . . . . . . . . . . . . . . . . . . . . . . . . . . . . . . . . . . . . . . . . . . (857) (12,196) (6,948)
Long-term debt payments . . . . . . . . . . . . . . . . . . . . . . . . . . . . . . . . . . . . . . . . . . . . . . . . . . . . . (142,480) (946,070) (227,693)
Premium paid to retire debt . . . . . . . . . . . . . . . . . . . . . . . . . . . . . . . . . . . . . . . . . . . . . . . . . . . (6,290) (20,186) —
Settlement of interest rate swaps . . . . . . . . . . . . . . . . . . . . . . . . . . . . . . . . . . . . . . . . . . . . . . 15,521 — —
Issuance of common stock . . . . . . . . . . . . . . . . . . . . . . . . . . . . . . . . . . . . . . . . . . . . . . . . . . . . 1,398 13,808 27,200
Common stock repurchased . . . . . . . . . . . . . . . . . . . . . . . . . . . . . . . . . . . . . . . . . . . . . . . . . . . (200,000) (250,000) (135,239)
Dividends paid . . . . . . . . . . . . . . . . . . . . . . . . . . . . . . . . . . . . . . . . . . . . . . . . . . . . . . . . . . . . . . . (318,437) (336,025) (323,671)
Repayment of customer advances for construction . . . . . . . . . . . . . . . . . . . . . . . . . . . . . . (3,185) (942) (264)
Net cash used by financing activities. . . . . . . . . . . . . . . . . . . . . . . . . . . . . . . . . . . . . . . . . . . . . . . (519,330) (601,611) (116,615)
Cash flows of discontinued operations:
Operating cash flows . . . . . . . . . . . . . . . . . . . . . . . . . . . . . . . . . . . . . . . . . . . . . . . . . . . . . . . . . — — 17,833
Investing cash flows . . . . . . . . . . . . . . . . . . . . . . . . . . . . . . . . . . . . . . . . . . . . . . . . . . . . . . . . . . — — (6,593)
Financing cash flows . . . . . . . . . . . . . . . . . . . . . . . . . . . . . . . . . . . . . . . . . . . . . . . . . . . . . . . . . — — —
Net cash provided by discontinued operations. . . . . . . . . . . . . . . . . . . . . . . . . . . . . . . . . . . . . . . — — 11,240
(Decrease) increase in cash and cash equivalents. . . . . . . . . . . . . . . . . . . . . . . . . . . . . . . . . . . . (62,839) (814,640) 777,357
Cash and cash equivalents at January 1, . . . . . . . . . . . . . . . . . . . . . . . . . . . . . . . . . . . . . . . . . . . . 226,466 1,041,106 263,749
Cash and cash equivalents at December 31, . . . . . . . . . . . . . . . . . . . . . . . . . . . . . . . . . . . . . . . . $ 163,627 $ 226,466 $1,041,106
Cash paid during the period for:
Interest. . . . . . . . . . . . . . . . . . . . . . . . . . . . . . . . . . . . . . . . . . . . . . . . . . . . . . . . . . . . . . . . . . . . . . . $ 365,858 $ 364,381 $ 332,204
Income taxes . . . . . . . . . . . . . . . . . . . . . . . . . . . . . . . . . . . . . . . . . . . . . . . . . . . . . . . . . . . . . . . . . $ 78,878 $ 54,407 $ 5,365
Non-cash investing and financing activities:
Change in fair value of interest rate swaps. . . . . . . . . . . . . . . . . . . . . . . . . . . . . . . . . . . . . $ 7,909 $ 18,198 $ (1,562)
Conversion of EPPICS. . . . . . . . . . . . . . . . . . . . . . . . . . . . . . . . . . . . . . . . . . . . . . . . . . . . . . . . $ 590 $ 3,339 $ 15,925
Conversion of Commonwealth notes . . . . . . . . . . . . . . . . . . . . . . . . . . . . . . . . . . . . . . . . . . . $ 1,666 $ 36,731 $ —
Debt-for-debt exchange . . . . . . . . . . . . . . . . . . . . . . . . . . . . . . . . . . . . . . . . . . . . . . . . . . . . . . . $ — $ — $ 2,433
Shares issued for Commonwealth acquisition. . . . . . . . . . . . . . . . . . . . . . . . . . . . . . . . . . . $ 39 $ 247,435 $ —
Acquired debt . . . . . . . . . . . . . . . . . . . . . . . . . . . . . . . . . . . . . . . . . . . . . . . . . . . . . . . . . . . . . . . . $ — $ 244,570 $ —
Other acquired liabilities . . . . . . . . . . . . . . . . . . . . . . . . . . . . . . . . . . . . . . . . . . . . . . . . . . . . . . $ — $ 112,194 $ —
The accompanying Notes are an integral part of these Consolidated Financial Statements.
F-9