Frontier Communications 2008 Annual Report Download - page 40
Download and view the complete annual report
Please find page 40 of the 2008 Frontier Communications annual report below. You can navigate through the pages in the report by either clicking on the pages listed below, or by using the keyword search tool below to find specific information within the annual report.-
 1
1 -
2
-
3
-
4
-
5
-
6
-
7
-
8
-
9
-
10
-
11
-
12
-
13
-
14
-
15
-
16
-
17
-
18
-
19
-
20
-
21
-
22
-
23
-
24
-
25
-
26
-
27
-
28
-
29
-
 30
30 -
 31
31 -
 32
32 -
 33
33 -
 34
34 -
 35
35 -
 36
36 -
 37
37 -
 38
38 -
 39
39 -
 40
40 -
 41
41 -
 42
42 -
 43
43 -
 44
44 -
 45
45 -
 46
46 -
 47
47 -
 48
48 -
 49
49 -
 50
50 -
51
-
52
-
53
-
54
-
55
-
56
-
57
-
58
-
59
-
60
-
61
-
62
-
63
-
64
-
65
-
66
-
67
-
68
-
69
-
70
-
71
-
72
-
73
-
74
-
75
-
76
-
77
-
78
-
79
-
80
-
81
-
82
-
83
-
84
-
85
-
86
-
87
-
88
-
89
-
90
-
91
-
92
-
93
-
94
-
95
-
96
-
97
-
98
-
99
 |
 |

enabled us to realize cost savings by leveraging our centralized back office, customer service and
administrative support functions over a larger customer base.
All other operating expenses for 2007 increased $47.5 million, or 13%, to $404.3 million as compared to
2006. Excluding the additional expenses attributable to the CTE and GVN acquisitions of $72.1 million in
2007, all other operating expenses for 2007 decreased $24.6 million, or 7%, as compared to 2006, primarily due
to the allocation of common corporate costs over a larger base of operations, which now includes CTE.
Additionally, our USF contribution rate and PUC fees decreased from 2006, resulting in a reduction in costs of
$13.1 million in 2007. An increase in consulting and other outside services of $11.7 million for 2007 offset
some of the decrease in expenses noted above.
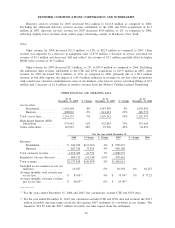
DEPRECIATION AND AMORTIZATION EXPENSE
($ in thousands) Amount $ Change % Change Amount Acquisitions
Frontier (excluding
CTE and GVN) $ Change % Change Amount
2008 2007 2006
Depreciation expense. . . . . . . . $379,490 $ 5,055 1% $374,435 $45,289 $329,146 $(20,961) -6% $350,107
Amortization expense . . . . . . . 182,311 10,890 6% 171,421 45,042(1) 126,379 (1) 0% 126,380
$561,801 $15,945 3% $545,856 $90,331 $455,525 $(20,962) -4% $476,487
(1) Represents amortization expense related to the customer base acquired in the CTE and GVN acquisitions,
and the Commonwealth trade name. Our assessment of the value of the customer base and trade name, and
associated expected useful life, are based upon management estimate and independent appraisal.
Depreciation and amortization expense for 2008 increased $15.9 million, or 3%, to $561.8 million as
compared to 2007. Excluding the depreciation and amortization expense for 2008 and 2007 attributable to the
CTE and GVN acquisitions, depreciation and amortization expense for 2008 decreased $10.7 million, or 2%, as
compared to 2007, primarily due to a declining net asset base for our legacy Frontier properties, partially offset
by changes in the remaining useful lives of certain assets. An independent study updating the estimated
remaining useful lives of our plant assets is performed annually. We adopted the remaining useful lives
proposed in the study effective October 1, 2008. Our “composite depreciation rate” increased from 5.5% to
5.6% as a result of the study. We anticipate depreciation expense of approximately $350.0 million to $370.0
million and amortization expense of $113.9 million for 2009.
Consolidated depreciation and amortization expense for 2007 increased $69.4 million, or 15%, to $545.9
million as compared to 2006 as a result of our 2007 acquisitions of CTE and GVN. Excluding the impact of the
CTE and GVN acquisitions, depreciation expense for 2007 decreased $21.0 million, or 6%, as compared to
2006 due to a declining net asset base partially offset by changes in the remaining useful lives of certain assets.
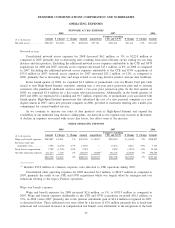
INVESTMENT INCOME/OTHER INCOME (LOSS), NET / INTEREST EXPENSE /
INCOME TAX EXPENSE
($ in thousands) Amount $ Change % Change Amount Acquisitions
Frontier (excluding
CTE and GVN) $ Change % Change Amount
2008 2007 2006
Investment income . ......... $ 14,504 $(21,277) -59% $ 35,781 $ 402 $ 35,379 $(44,057) -55% $ 79,436
Other income (loss), net. . . . . $ (5,170) $ 12,663 71% $ (17,833) $ 4,978 $ (22,811) $(25,818) -859% $ 3,007
Interest expense . . . ......... $362,634 $(18,062) -5% $380,696 $ (260) $380,956 $ 44,510 13% $336,446
Income tax expense ......... $106,496 $(21,518) -17% $128,014 $27,013 $101,001 $(35,478) -26% $136,479
Investment Income
Investment income for 2008 decreased $21.3 million, or 59%, to $14.5 million as compared to 2007,
primarily due to a decrease of $22.1 million in income from short-term investments of cash and cash
equivalents due to a lower investable cash balance.
Investment income for 2007 decreased $43.7 million, or 55%, to $35.8 million as compared to 2006.
Excluding the investment income attributable to the CTE and GVN acquisitions of $0.4 million, investment
39
FRONTIER COMMUNICATIONS CORPORATION AND SUBSIDIARIES