Frontier Communications 2008 Annual Report Download - page 57
Download and view the complete annual report
Please find page 57 of the 2008 Frontier Communications annual report below. You can navigate through the pages in the report by either clicking on the pages listed below, or by using the keyword search tool below to find specific information within the annual report.-
 1
1 -
2
-
3
-
4
-
5
-
6
-
7
-
8
-
9
-
10
-
11
-
12
-
13
-
14
-
15
-
16
-
17
-
18
-
19
-
20
-
21
-
22
-
23
-
24
-
25
-
26
-
27
-
28
-
29
-
30
-
31
-
32
-
33
-
34
-
35
-
36
-
37
-
38
-
39
-
40
-
41
-
42
-
43
-
44
-
45
-
46
-
 47
47 -
 48
48 -
 49
49 -
 50
50 -
 51
51 -
 52
52 -
 53
53 -
 54
54 -
 55
55 -
 56
56 -
 57
57 -
 58
58 -
 59
59 -
 60
60 -
 61
61 -
 62
62 -
 63
63 -
 64
64 -
 65
65 -
 66
66 -
 67
67 -
68
-
69
-
70
-
71
-
72
-
73
-
74
-
75
-
76
-
77
-
78
-
79
-
80
-
81
-
82
-
83
-
84
-
85
-
86
-
87
-
88
-
89
-
90
-
91
-
92
-
93
-
94
-
95
-
96
-
97
-
98
-
99
 |
 |

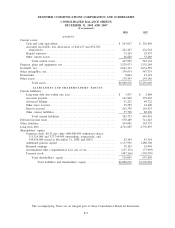
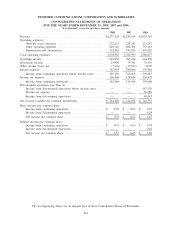
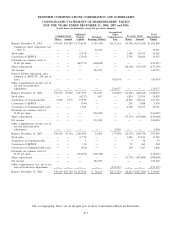
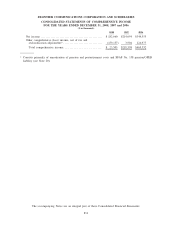
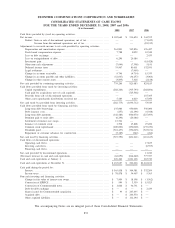
FRONTIER COMMUNICATIONS CORPORATION AND SUBSIDIARIES
CONSOLIDATED STATEMENTS OF OPERATIONS
FOR THE YEARS ENDED DECEMBER 31, 2008, 2007 and 2006
($ in thousands, except for per-share amounts)
2008 2007 2006
Revenue ......................................................... $2,237,018 $2,288,015 $2,025,367
Operating expenses:
Network access expenses .................................... 222,013 228,242 171,247
Other operating expenses .................................... 810,748 808,501 733,143
Depreciation and amortization . . .............................. 561,801 545,856 476,487
Total operating expenses . . ....................................... 1,594,562 1,582,599 1,380,877
Operating income ................................................ 642,456 705,416 644,490
Investment income ............................................... 14,504 35,781 79,436
Other income (loss), net . . . ....................................... (5,170) (17,833) 3,007
Interest expense . . ................................................ 362,634 380,696 336,446
Income from continuing operations before income taxes ....... 289,156 342,668 390,487
Income tax expense .............................................. 106,496 128,014 136,479
Income from continuing operations ........................... 182,660 214,654 254,008
Discontinued operations (see Note 8):
Income from discontinued operations before income taxes . . . . . — — 147,136
Income tax expense. . . ....................................... — — 56,589
Income from discontinued operations ......................... — — 90,547
Net income available for common shareholders .................... $ 182,660 $ 214,654 $ 344,555
Basic income per common share:
Income from continuing operations ........................... $ 0.58 $ 0.65 $ 0.79
Income from discontinued operations ......................... — — 0.28
Net income per common share . .............................. $ 0.58 $ 0.65 $ 1.07
Diluted income per common share:
Income from continuing operations ........................... $ 0.57 $ 0.65 $ 0.78
Income from discontinued operations ......................... — — 0.28
Net income per common share . .............................. $ 0.57 $ 0.65 $ 1.06
The accompanying Notes are an integral part of these Consolidated Financial Statements.
F-6