Frontier Communications 2008 Annual Report Download - page 34
Download and view the complete annual report
Please find page 34 of the 2008 Frontier Communications annual report below. You can navigate through the pages in the report by either clicking on the pages listed below, or by using the keyword search tool below to find specific information within the annual report.-
 1
1 -
2
-
3
-
4
-
5
-
6
-
7
-
8
-
9
-
10
-
11
-
12
-
13
-
14
-
15
-
16
-
17
-
18
-
19
-
20
-
21
-
22
-
23
-
 24
24 -
 25
25 -
 26
26 -
 27
27 -
 28
28 -
 29
29 -
 30
30 -
 31
31 -
 32
32 -
 33
33 -
 34
34 -
 35
35 -
 36
36 -
 37
37 -
 38
38 -
 39
39 -
 40
40 -
 41
41 -
 42
42 -
 43
43 -
 44
44 -
45
-
46
-
47
-
48
-
49
-
50
-
51
-
52
-
53
-
54
-
55
-
56
-
57
-
58
-
59
-
60
-
61
-
62
-
63
-
64
-
65
-
66
-
67
-
68
-
69
-
70
-
71
-
72
-
73
-
74
-
75
-
76
-
77
-
78
-
79
-
80
-
81
-
82
-
83
-
84
-
85
-
86
-
87
-
88
-
89
-
90
-
91
-
92
-
93
-
94
-
95
-
96
-
97
-
98
-
99
 |
 |

$42.7 million, or 2%, as compared to 2006, primarily resulting from a reduction of $39.9 million in subsidies
received from federal and state funds.
Change in the number of our access lines is one factor that is important to our revenue and profitability.
We have lost access lines primarily because of competition, changing consumer behavior (including wireless
substitution), economic conditions, changing technology and by some customers disconnecting second lines
when they add High-Speed Internet or cable modem service. We lost approximately 174,800 access lines (net),
including 22,200 second lines, during 2008, but added approximately 57,100 High-Speed Internet subscribers
(net) during this same period. We expect to continue to lose access lines but to increase High-Speed Internet
subscribers during 2009 (although not enough to offset access line losses).
While the number of access lines are an important metric to gauge certain revenue trends, it is not
necessarily the best or only measure to evaluate the business. Management believes that understanding different
components of revenue is most important. For this reason, presented on page 33 is a breakdown that categorizes
revenue into customer revenue and regulatory revenue (switched and subsidy revenue). Despite the decline in
access lines, our customer revenue, which is all revenue except switched access and subsidy revenue, also
improved by more than 1.3 percent in 2008 versus 2007. The average monthly customer revenue per access line
has improved and resulted in an increased wallet share, primarily from residential customers. A substantial
further loss of access lines, combined with increased competition and the other factors discussed herein may
cause our revenue, profitability and cash flows to decrease in 2009.
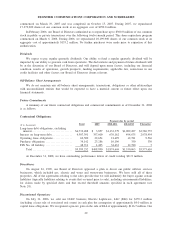
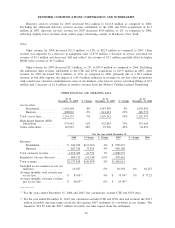
Our historical results include the results of operations of Commonwealth from the date of its acquisition
on March 8, 2007 and of GVN from the date of its acquisition on October 31, 2007. The financial tables below
include a comparative analysis of our results of operations on a historical basis for 2008, 2007 and 2006. We
have also presented an analysis of each category for 2007 for the results of Frontier (excluding CTE and GVN)
and the results of our acquisitions: CTE from March 8, 2007 through December 31, 2007, and the results of
GVN for the last two months of 2007, as included in the consolidated results of operations. The figures in each
of the charts in this section for 2007 relate to Frontier legacy properties (excluding CTE and GVN).
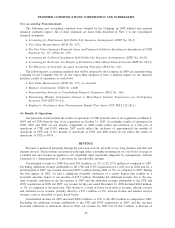
REVENUE
($ in thousands) Amount $ Change % Change Amount Acquisitions
Frontier (excluding
CTE and GVN) $ Change % Change Amount
2008 2007 2006
Local services . . ....... $ 848,393 $(27,369) -3% $ 875,762 $ 95,197 $ 780,565 $(29,019) -4% $ 809,584
Data and internet
services . . . . . . ....... 605,615 61,851 11% 543,764 58,934 484,830 60,621 14% 424,209
Access services. ....... 404,713 (74,749) -16% 479,462 70,235 409,227 (18,732) -4% 427,959
Long distance services . 182,559 2,034 1% 180,525 27,070 153,455 183 0% 153,272
Directory services . . . . . 113,347 (1,239) -1% 114,586 1,264 113,322 (816) -1% 114,138
Other . . . . . . . . . . ....... 82,391 (11,525) -12% 93,916 13,908 80,008 (16,197) -17% 96,205
$2,237,018 $(50,997) -2% $2,288,015 $266,608 $2,021,407 $ (3,960) 0% $2,025,367
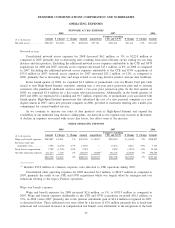
Local Services
Local services revenue for 2008 decreased $27.4 million, or 3%, to $848.4 million as compared to 2007.
Excluding the additional local services revenue attributable to the CTE and GVN acquisitions for 2008 and
2007, local services revenue for 2008 decreased $47.8 million, or 6%, as compared to 2007, primarily due to
the continued loss of access lines which accounted for $40.4 million of the decline and a reduction in all other
related services of $7.4 million. Enhanced services revenue for 2008, excluding the impact of the CTE and
GVN acquisitions for 2008 and 2007, decreased $5.6 million, or 3%, as compared to 2007, primarily due to a
decline in access lines and a shift in customers purchasing our unlimited voice communications packages
instead of individual features. Rate increases that were effective August 2007 resulted in a favorable 2008
impact of $3.0 million.
Local services revenue for 2007 increased $66.2 million, or 8%, to $875.8 million as compared to 2006.
Excluding the additional local services revenue attributable to the CTE and GVN acquisitions of $95.2 million
in 2007, local services revenue for 2007 decreased $29.0 million, or 4%, to $780.6 million as compared to
33
FRONTIER COMMUNICATIONS CORPORATION AND SUBSIDIARIES