Frontier Communications 2008 Annual Report Download - page 6
Download and view the complete annual report
Please find page 6 of the 2008 Frontier Communications annual report below. You can navigate through the pages in the report by either clicking on the pages listed below, or by using the keyword search tool below to find specific information within the annual report.-
 1
1 -
 2
2 -
 3
3 -
 4
4 -
 5
5 -
 6
6 -
 7
7 -
 8
8 -
 9
9 -
 10
10 -
 11
11 -
 12
12 -
 13
13 -
 14
14 -
 15
15 -
 16
16 -
 17
17 -
18
-
19
-
20
-
21
-
22
-
23
-
24
-
25
-
26
-
27
-
28
-
29
-
30
-
31
-
32
-
33
-
34
-
35
-
36
-
37
-
38
-
39
-
40
-
41
-
42
-
43
-
44
-
45
-
46
-
47
-
48
-
49
-
50
-
51
-
52
-
53
-
54
-
55
-
56
-
57
-
58
-
59
-
60
-
61
-
62
-
63
-
64
-
65
-
66
-
67
-
68
-
69
-
70
-
71
-
72
-
73
-
74
-
75
-
76
-
77
-
78
-
79
-
80
-
81
-
82
-
83
-
84
-
85
-
86
-
87
-
88
-
89
-
90
-
91
-
92
-
93
-
94
-
95
-
96
-
97
-
98
-
99
 |
 |

Wireless services. During 2006, we began offering wireless data services in certain markets. Our wireless
data services utilize technologies that are relatively new, and we depend to some degree on the representations
of equipment vendors, lab testing and the experiences of others who have been successful at deploying these
new technologies. As of December 31, 2008, we provided wireless data WIFI networks in 18 municipalities,
four colleges and universities and over 120 business establishments. Revenue is recognized when services are
provided to customers. Long-term contracts are billed in advance on an annual or semi-annual basis. End-user
subscribers are billed in advance on a monthly recurring basis and colleges, universities and businesses are
billed on a monthly recurring basis for a fixed number of users. The unearned portion of this revenue is initially
deferred as a component of other liabilities on our balance sheet and recognized as revenue over the period that
the services are provided. Hourly, daily and weekly casual end-users are billed by credit card at the time of use.
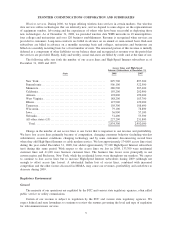
The following table sets forth the number of our access lines and High-Speed Internet subscribers as of
December 31, 2008 and 2007.
State 2008 2007
Access Lines and High-Speed
Internet Subscribers at December 31,
New York .................................................... 825,700 897,300
Pennsylvania .................................................. 506,100 522,500
Minnesota. .................................................... 280,500 287,400
California ..................................................... 193,200 202,900
Arizona . ...................................................... 192,800 199,600
West Virginia ................................................. 188,200 183,700
Illinois. . ...................................................... 127,900 129,000
Tennessee..................................................... 105,300 108,600
Wisconsin. .................................................... 79,100 78,800
Iowa.......................................................... 56,900 57,100
Nebraska...................................................... 51,400 53,300
All other states (13) ........................................... 227,200 231,800
Total . ...................................................... 2,834,300 2,952,000
Change in the number of our access lines is one factor that is important to our revenue and profitability.
We have lost access lines primarily because of competition, changing consumer behavior (including wireless
substitution), economic conditions, changing technology and by some customers disconnecting second lines
when they add High-Speed Internet or cable modem service. We lost approximately 174,800 access lines (net)
during the year ended December 31, 2008, but added approximately 57,100 High-Speed Internet subscribers
(net) during this same period. With respect to the access lines we lost in 2008, 133,700 were residential
customer lines and 41,100 were business customer lines. The business line losses were principally in our
eastern region and Rochester, New York, while the residential losses were throughout our markets. We expect
to continue to lose access lines but to increase High-Speed Internet subscribers during 2009 (although not
enough to offset access line losses). A substantial further loss of access lines, combined with increased
competition and the other factors discussed in MD&A, may cause our revenues, profitability and cash flows to
decrease during 2009.
Regulatory Environment
General
The majority of our operations are regulated by the FCC and various state regulatory agencies, often called
public service or utility commissions.
Certain of our revenue is subject to regulation by the FCC and various state regulatory agencies. We
expect federal and state lawmakers to continue to review the statutes governing the level and type of regulation
for telecommunications services.
5
FRONTIER COMMUNICATIONS CORPORATION AND SUBSIDIARIES