Frontier Communications 2008 Annual Report Download - page 35
Download and view the complete annual report
Please find page 35 of the 2008 Frontier Communications annual report below. You can navigate through the pages in the report by either clicking on the pages listed below, or by using the keyword search tool below to find specific information within the annual report.-
 1
1 -
2
-
3
-
4
-
5
-
6
-
7
-
8
-
9
-
10
-
11
-
12
-
13
-
14
-
15
-
16
-
17
-
18
-
19
-
20
-
21
-
22
-
23
-
24
-
 25
25 -
 26
26 -
 27
27 -
 28
28 -
 29
29 -
 30
30 -
 31
31 -
 32
32 -
 33
33 -
 34
34 -
 35
35 -
 36
36 -
 37
37 -
 38
38 -
 39
39 -
 40
40 -
 41
41 -
 42
42 -
 43
43 -
 44
44 -
 45
45 -
46
-
47
-
48
-
49
-
50
-
51
-
52
-
53
-
54
-
55
-
56
-
57
-
58
-
59
-
60
-
61
-
62
-
63
-
64
-
65
-
66
-
67
-
68
-
69
-
70
-
71
-
72
-
73
-
74
-
75
-
76
-
77
-
78
-
79
-
80
-
81
-
82
-
83
-
84
-
85
-
86
-
87
-
88
-
89
-
90
-
91
-
92
-
93
-
94
-
95
-
96
-
97
-
98
-
99
 |
 |
2006. The loss of access lines accounted for $28.7 million of this decline in local services revenue, partially
offset by rate increases in Rochester, New York on residential lines that became effective August 2006 and
2007.
Economic conditions and/or increasing competition could make it more difficult to sell our packages and
bundles and cause us to increase our promotions and/or lower our prices for our products and services, which
would adversely affect our revenue, profitability and cash flow.
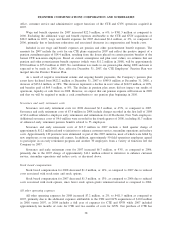
Data and Internet Services
Data and internet services revenue for 2008 increased $61.9 million, or 11%, to $605.6 million as
compared to 2007. Data and internet services revenue for 2008, excluding the additional data and internet
services revenue attributable to the CTE and GVN acquisitions for 2008 and 2007 increased $37.3 million, or
8%, as compared to 2007, primarily due to the overall growth in the number of data and High-Speed Internet
customers. As of December 31, 2008, the number of the Company’s High-Speed Internet subscribers increased
by approximately 57,100, or 11%, since December 31, 2007. Data and internet services also includes revenue
from data transmission services to other carriers and high-volume commercial customers with dedicated high-
capacity internet and ethernet circuits. Revenue from these dedicated high-capacity circuits, including the
impact of $10.5 million attributable to the CTE and GVN acquisitions, increased $26.9 million in 2008, as
compared to 2007, primarily due to growth in the number of those circuits.
Data and internet services revenue for 2007 increased $119.6 million, or 28%, to $543.8 million as
compared to 2006. Excluding the additional data and internet services revenue attributable to the CTE and
GVN acquisitions for 2007, data and internet services revenue for 2007 increased $60.6 million, or 14%, as
compared to 2006, primarily due to growth in the number of data and High-Speed Internet customers. As of
December 31, 2007, the number of the Company’s High-Speed Internet subscribers increased by approximately
66,700, or 17%, since December 31, 2006. Revenue from dedicated high-capacity circuits increased $19.8
million in 2007, primarily due to growth in the number of those circuits.
Access Services
Access services revenue for 2008 decreased $74.7 million, or 16%, to $404.7 million as compared to 2007.
Excluding the additional access services revenue attributable to the CTE and GVN acquisitions for 2008 and
2007, access services revenue for 2008 decreased $77.3 million, or 19%, as compared to 2007, for our legacy
Frontier operations. Switched access revenue for 2008, excluding the unfavorable impact of the CTE and GVN
acquisitions, decreased $56.8 million, or 20%, as compared to 2007, primarily due to the settlement of a carrier
dispute resulting in a favorable impact on our 2007 revenue of $38.7 million (a one-time event), and the impact
of a decline in minutes of use related to access line losses and the displacement of minutes of use by wireless,
email and other communications services. Excluding the impact of that one-time favorable settlement in 2007,
our switched access revenue for 2008 declined by $18.1 million, or 7% from 2007. Access services revenue
includes subsidy payments we receive from federal and state agencies. Subsidy revenue for 2008, excluding the
additional subsidy revenue attributable to the CTE and GVN acquisitions in 2008 and 2007, decreased $20.6
million, or 16%, in 2008 to $104.1 million, as compared to 2007, primarily due to lower receipts under the
Federal High Cost Fund program resulting from our reduced cost structure and an increase in the program’s
National Average Cost Per Local Loop (NACPL) used by the Federal Communications Commission (FCC) to
allocate funds among all recipients. Subsidy revenue in 2008 was also negatively impacted by $2.5 million in
unfavorable adjustments resulting from audits of the Federal High Cost Fund program.
Access services revenue for 2007 increased $51.5 million, or 12%, to $479.5 million as compared to 2006.
Excluding the additional access services revenue attributable to the CTE and GVN acquisitions of $70.2 million
in 2007, access services revenue for 2007 decreased $18.7 million, or 4%, as compared to 2006. Switched
access revenue of $284.6 million increased $21.2 million, or 8%, as compared to 2006, primarily due to the
settlement in the first quarter of 2007 of a dispute with a carrier resulting in a favorable impact on our revenue
in 2007 of $38.7 million (a one-time event), partially offset by the impact of a decline in minutes of use related
to access line losses. Subsidy revenue for 2007 of $124.7 million decreased $39.9 million, or 24%, as compared
to 2006, primarily due to lower receipts under the Federal High Cost Fund program resulting from our reduced
34
FRONTIER COMMUNICATIONS CORPORATION AND SUBSIDIARIES