Costco 2012 Annual Report Download - page 74
Download and view the complete annual report
Please find page 74 of the 2012 Costco annual report below. You can navigate through the pages in the report by either clicking on the pages listed below, or by using the keyword search tool below to find specific information within the annual report.-
 1
1 -
2
-
3
-
4
-
5
-
6
-
7
-
8
-
9
-
10
-
11
-
12
-
13
-
14
-
15
-
16
-
17
-
18
-
19
-
20
-
21
-
22
-
23
-
24
-
25
-
26
-
27
-
28
-
29
-
30
-
31
-
32
-
33
-
34
-
35
-
36
-
37
-
38
-
39
-
40
-
41
-
42
-
43
-
44
-
45
-
46
-
47
-
48
-
49
-
50
-
51
-
52
-
53
-
54
-
55
-
56
-
57
-
58
-
59
-
60
-
61
-
62
-
63
-
 64
64 -
 65
65 -
 66
66 -
 67
67 -
 68
68 -
 69
69 -
 70
70 -
 71
71 -
 72
72 -
 73
73 -
 74
74 -
 75
75 -
 76
76 -
 77
77 -
 78
78 -
 79
79 -
 80
80
 |
 |

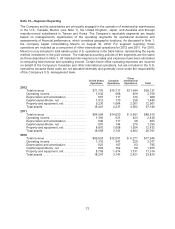
Note 12—Segment Reporting
The Company and its subsidiaries are principally engaged in the operation of membership warehouses
in the U.S., Canada, Mexico (see Note 1), the United Kingdom, Japan, and Australia and through
majority-owned subsidiaries in Taiwan and Korea. The Company’s reportable segments are largely
based on management’s organization of the operating segments for operational decisions and
assessments of financial performance, which considers geographic locations. As discussed in Note 1,
the Company began consolidating Mexico on August 30, 2010. For segment reporting, these
operations are included as a component of other international operations for 2012 and 2011. For 2010,
Mexico is only included in total assets under U.S. operations in the table below, representing the equity
method investment in the joint venture. The material accounting policies of the segments are the same
as those described in Note 1. All material inter-segment net sales and expenses have been eliminated
in computing total revenue and operating income. Certain home office operating expenses are incurred
on behalf of the Company’s Canadian and other international operations, but are included in the U.S.
operations because those costs are not allocated internally and generally come under the responsibility
of the Company’s U.S. management team.
United States
Operations
Canadian
Operations
Other
International
Operations Total
2012
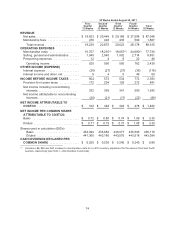
Total revenue .......................... $71,776 $15,717 $11,644 $99,137
Operating income ....................... 1,632 668 459 2,759
Depreciation and amortization ............. 667 117 124 908
Capital expenditures, net ................. 1,012 170 298 1,480
Property and equipment, net .............. 9,236 1,664 2,061 12,961
Total assets ............................ 18,401 4,237 4,502 27,140
2011
Total revenue .......................... $64,904 $14,020 $ 9,991 $88,915
Operating income ....................... 1,395 621 423 2,439
Depreciation and amortization ............. 640 117 98 855
Capital expenditures, net ................. 876 144 270 1,290
Property and equipment, net .............. 8,870 1,608 1,954 12,432
Total assets ............................ 18,558 3,741 4,462 26,761
2010
Total revenue .......................... $59,624 $12,051 $ 6,271 $77,946
Operating income ....................... 1,310 547 220 2,077
Depreciation and amortization ............. 625 107 63 795
Capital expenditures, net ................. 804 162 89 1,055
Property and equipment, net .............. 8,709 1,474 1,131 11,314
Total assets ............................ 18,247 3,147 2,421 23,815
72