Costco 2012 Annual Report Download - page 29
Download and view the complete annual report
Please find page 29 of the 2012 Costco annual report below. You can navigate through the pages in the report by either clicking on the pages listed below, or by using the keyword search tool below to find specific information within the annual report.-
 1
1 -
2
-
3
-
4
-
5
-
6
-
7
-
8
-
9
-
10
-
11
-
12
-
13
-
14
-
15
-
16
-
17
-
18
-
 19
19 -
 20
20 -
 21
21 -
 22
22 -
 23
23 -
 24
24 -
 25
25 -
 26
26 -
 27
27 -
 28
28 -
 29
29 -
 30
30 -
 31
31 -
 32
32 -
 33
33 -
 34
34 -
 35
35 -
 36
36 -
 37
37 -
 38
38 -
 39
39 -
40
-
41
-
42
-
43
-
44
-
45
-
46
-
47
-
48
-
49
-
50
-
51
-
52
-
53
-
54
-
55
-
56
-
57
-
58
-
59
-
60
-
61
-
62
-
63
-
64
-
65
-
66
-
67
-
68
-
69
-
70
-
71
-
72
-
73
-
74
-
75
-
76
-
77
-
78
-
79
-
80
 |
 |
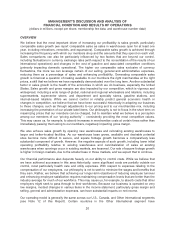
relatively higher rates of square footage growth, lower wage and benefits as a percentage of country
sales, and/or less direct membership warehouse competition. Additionally, we operate our lower-
margin gasoline business only in the United States and Canada.
In discussions of our consolidated operating results, we refer to the impact of changes in foreign
currencies relative to the U.S. dollar, which are references to the differences between the
foreign-exchange rates we use to convert the financial results of our international operations from local
currencies into U.S. dollars for financial reporting purposes. This impact of foreign-exchange rate
changes is typically calculated as the difference between the current year currency exchange rates and
the comparable prior-year currency exchange rates.
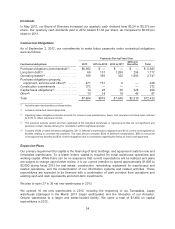
Our fiscal year ends on the Sunday closest to August 31. Fiscal 2012 is a 53-week year ending on
September 2, 2012, while fiscal years 2011 and 2010 were 52-week periods. Certain percentages
presented are calculated using actual results prior to rounding. Unless otherwise noted, references to
net income relate to net income attributable to Costco.
Highlights for fiscal year 2012 included:
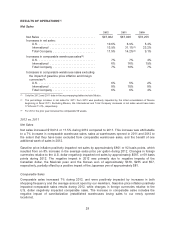
• Net sales increased 11.5% to $97,062, driven by a 7% increase in comparable sales, sales
at warehouses opened in 2011 and 2012 to the extent that they have been excluded from
comparable warehouse sales, and the benefit of one additional week of sales in 2012. Net
sales were favorably impacted by increases in the price of gasoline, partially offset by the
weakening of certain foreign currencies against the U.S. dollar;
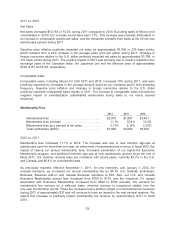
• Membership fees increased 11.1% to $2,075, primarily due to new member sign-ups at
warehouses open for more than one year, an extra week of membership fees in fiscal 2012,
the impact of raising our annual membership fees, increased penetration of our higher-fee
Executive Membership program, and additional member sign-ups at new warehouses
opened since the end of fiscal 2011;
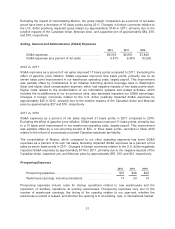
• Gross margin (net sales less merchandise costs) as a percentage of net sales decreased 14
basis points. This comparison was positively impacted by eight basis points due to a $66
lower LIFO inventory charge in 2012 compared to 2011;
• Selling, general and administrative (SG&A) expenses as a percentage of net sales improved
17 basis points;
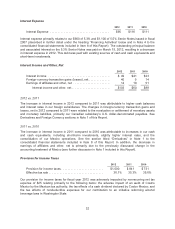
• Net income in 2012 increased 16.9% to $1,709, or $3.89 per diluted share compared to
$1,462, or $3.30 per diluted share in 2011;
• The Board of Directors approved an increase in the quarterly cash dividend from $0.24 to
$0.275 per share;
• We repurchased 7,272 shares of our common stock, at an average cost of $84.75 per share,
totaling approximately $617; and
• In July, we purchased from our joint venture partner, Controladora Comercial Mexicana, its
50% equity interest in Costco Mexico for $789.
27