Costco 2012 Annual Report Download - page 30
Download and view the complete annual report
Please find page 30 of the 2012 Costco annual report below. You can navigate through the pages in the report by either clicking on the pages listed below, or by using the keyword search tool below to find specific information within the annual report.-
 1
1 -
2
-
3
-
4
-
5
-
6
-
7
-
8
-
9
-
10
-
11
-
12
-
13
-
14
-
15
-
16
-
17
-
18
-
19
-
 20
20 -
 21
21 -
 22
22 -
 23
23 -
 24
24 -
 25
25 -
 26
26 -
 27
27 -
 28
28 -
 29
29 -
 30
30 -
 31
31 -
 32
32 -
 33
33 -
 34
34 -
 35
35 -
 36
36 -
 37
37 -
 38
38 -
 39
39 -
 40
40 -
41
-
42
-
43
-
44
-
45
-
46
-
47
-
48
-
49
-
50
-
51
-
52
-
53
-
54
-
55
-
56
-
57
-
58
-
59
-
60
-
61
-
62
-
63
-
64
-
65
-
66
-
67
-
68
-
69
-
70
-
71
-
72
-
73
-
74
-
75
-
76
-
77
-
78
-
79
-
80
 |
 |

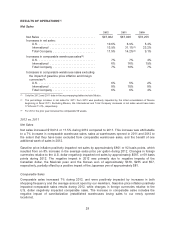
RESULTS OF OPERATIONS(1)
Net Sales
2012 2011 2010
Net Sales ................................... $97,062 $87,048 $76,255
Increases in net sales:
U.S. .................................... 10.6% 8.9% 5.4%
International ............................. 13.9% 31.1%(2) 23.2%
Total Company ........................... 11.5% 14.2%(2) 9.1%
Increases in comparable warehouse sales(3):
U.S. .................................... 7% 7% 4%
International ............................. 6% 16% 19%
Total Company ........................... 7% 10% 7%
Increases in comparable warehouse sales excluding
the impact of gasoline price inflation and foreign
currencies(3):
U.S. .................................... 6% 5% 2%
International ............................. 8% 10% 8%
Total Company ........................... 6% 6% 4%
(1) Only the 2012 and 2011 data in the accompanying tables include Mexico.
(2) The percentage increase in net sales for 2011 from 2010 was positively impacted by the initial consolidation of Mexico
beginning in fiscal 2011. Excluding Mexico, the International and Total Company increases in net sales would have been
17.6% and 11.0%, respectively.
(3) For 2012, the prior year includes the comparable 53 weeks.
2012 vs. 2011
Net Sales
Net sales increased $10,014 or 11.5% during 2012 compared to 2011. This increase was attributable
to a 7% increase in comparable warehouse sales, sales at warehouses opened in 2011 and 2012 to
the extent that they have been excluded from comparable warehouse sales, and the benefit of one
additional week of sales in 2012.
Gasoline price inflation positively impacted net sales by approximately $801 or 92 basis points, which
resulted from an 8% increase in the average sales price per gallon during 2012. Changes in foreign
currencies relative to the U.S. dollar negatively impacted net sales by approximately $597, or 69 basis
points during 2012. The negative impact in 2012 was primarily due to negative impacts of the
Canadian dollar, the Mexican peso and the Korean won of approximately $310, $255 and $57,
respectively, partially offset by a positive impact of the Japanese yen of approximately $81.
Comparable Sales
Comparable sales increased 7% during 2012, and were positively impacted by increases in both
shopping frequency and the average amount spent by our members. Gasoline price inflation positively
impacted comparable sales results during 2012, while changes in foreign currencies relative to the
U.S. dollar negatively impacted comparable sales. The increase in comparable sales includes the
negative impact of cannibalization (established warehouses losing sales to our newly opened
locations).
28