Costco 2012 Annual Report Download - page 66
Download and view the complete annual report
Please find page 66 of the 2012 Costco annual report below. You can navigate through the pages in the report by either clicking on the pages listed below, or by using the keyword search tool below to find specific information within the annual report.-
 1
1 -
2
-
3
-
4
-
5
-
6
-
7
-
8
-
9
-
10
-
11
-
12
-
13
-
14
-
15
-
16
-
17
-
18
-
19
-
20
-
21
-
22
-
23
-
24
-
25
-
26
-
27
-
28
-
29
-
30
-
31
-
32
-
33
-
34
-
35
-
36
-
37
-
38
-
39
-
40
-
41
-
42
-
43
-
44
-
45
-
46
-
47
-
48
-
49
-
50
-
51
-
52
-
53
-
54
-
55
-
 56
56 -
 57
57 -
 58
58 -
 59
59 -
 60
60 -
 61
61 -
 62
62 -
 63
63 -
 64
64 -
 65
65 -
 66
66 -
 67
67 -
 68
68 -
 69
69 -
 70
70 -
 71
71 -
 72
72 -
 73
73 -
 74
74 -
 75
75 -
 76
76 -
77
-
78
-
79
-
80
 |
 |

Restated 2002 Plan, amended in the second quarter of fiscal 2012, is the Company’s only active stock-
based compensation plan at the end of 2012. The Sixth Restated 2002 Plan authorized the issuance of
16,000,000 shares (9,143,000 RSUs) of common stock for future grants in addition to shares
previously authorized. The Company issues new shares of common stock upon exercise of stock
options and upon vesting of RSUs. RSUs are delivered to participants annually, net of shares equal to
the minimum statutory withholding taxes.
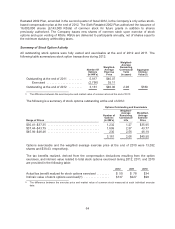
Summary of Stock Option Activity
All outstanding stock options were fully vested and exercisable at the end of 2012 and 2011. The
following table summarizes stock option transactions during 2012:
Number Of
Options
(in 000’s)
Weighted-
Average
Exercise
Price
Weighted-
Average
Remaining
Contractual
Term
(in years)
Aggregate
Intrinsic
Value(1)
Outstanding at the end of 2011 ......... 5,917 $40.07
Exercised ....................... (2,756) 39.11
Outstanding at the end of 2012 ......... 3,161 $40.90 2.06 $180
(1) The difference between the exercise price and market value of common stock at the end of 2012.
The following is a summary of stock options outstanding at the end of 2012:
Options Outstanding and Exercisable
Range of Prices
Number of
Options
(in 000’s)
Weighted-
Average
Remaining
Contractual
Life
Weighted-
Average
Exercise
Price
$30.41–$37.35 ................................. 1,232 1.27 $35.95
$37.44–$43.79 ................................. 1,699 2.57 43.77
$45.99–$46.46 ................................. 230 2.56 46.19
3,161 2.06 $40.90
Options exercisable and the weighted average exercise price at the end of 2010 were 13,032
shares and $39.43, respectively.
The tax benefits realized, derived from the compensation deductions resulting from the option
exercises, and intrinsic value related to total stock options exercised during 2012, 2011, and 2010
are provided in the following table:
2012 2011 2010
Actual tax benefit realized for stock options exercised ........ $ 50 $ 78 $34
Intrinsic value of stock options exercised(1) ................ $137 $227 $98
(1) The difference between the exercise price and market value of common stock measured at each individual exercise
date.
64