Costco 2012 Annual Report Download - page 61
Download and view the complete annual report
Please find page 61 of the 2012 Costco annual report below. You can navigate through the pages in the report by either clicking on the pages listed below, or by using the keyword search tool below to find specific information within the annual report.-
 1
1 -
2
-
3
-
4
-
5
-
6
-
7
-
8
-
9
-
10
-
11
-
12
-
13
-
14
-
15
-
16
-
17
-
18
-
19
-
20
-
21
-
22
-
23
-
24
-
25
-
26
-
27
-
28
-
29
-
30
-
31
-
32
-
33
-
34
-
35
-
36
-
37
-
38
-
39
-
40
-
41
-
42
-
43
-
44
-
45
-
46
-
47
-
48
-
49
-
50
-
 51
51 -
 52
52 -
 53
53 -
 54
54 -
 55
55 -
 56
56 -
 57
57 -
 58
58 -
 59
59 -
 60
60 -
 61
61 -
 62
62 -
 63
63 -
 64
64 -
 65
65 -
 66
66 -
 67
67 -
 68
68 -
 69
69 -
 70
70 -
 71
71 -
72
-
73
-
74
-
75
-
76
-
77
-
78
-
79
-
80
 |
 |

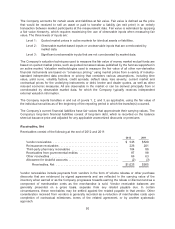
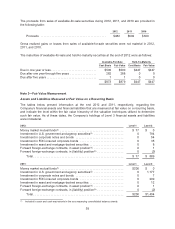
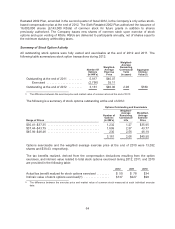
The proceeds from sales of available-for-sale securities during 2012, 2011, and 2010 are provided in
the following table:
2012 2011 2010
Proceeds .......................................... $482 $602 $309
Gross realized gains or losses from sales of available-for-sale securities were not material in 2012,
2011, and 2010.
The maturities of available-for-sale and held-to-maturity securities at the end of 2012 were as follows:
Available-For-Sale Held-To-Maturity
Cost Basis Fair Value Cost Basis Fair Value
Due in one year or less ............................. $590 $590 $447 $447
Due after one year through five years ................. 282 288 0 0
Due after five years ................................ 1 1 0 0
$873 $879 $447 $447
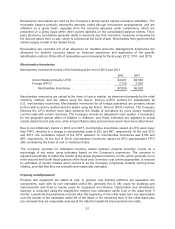
Note 3—Fair Value Measurement
Assets and Liabilities Measured at Fair Value on a Recurring Basis
The tables below present information at the end 2012 and 2011, respectively, regarding the
Company’s financial assets and financial liabilities that are measured at fair value on a recurring basis,
and indicate the level within the fair value hierarchy of the valuation techniques utilized to determine
such fair value. As of these dates, the Company’s holdings of Level 3 financial assets and liabilities
were immaterial.
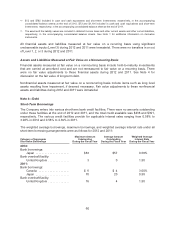
2012: Level 1 Level 2
Money market mutual funds(1) ......................................... $ 77 $ 0
Investment in U.S. government and agency securities(2) ................... 0 794
Investment in corporate notes and bonds ............................... 0 54
Investment in FDIC-insured corporate bonds ............................ 0 35
Investment in asset and mortgage-backed securities ...................... 0 8
Forward foreign-exchange contracts, in asset position(3) ................... 0 1
Forward foreign-exchange contracts, in (liability) position(3) ................. 0 (3)
Total .......................................................... $ 77 $ 889
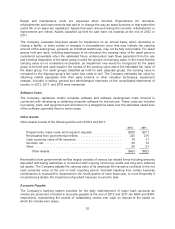
2011: Level 1 Level 2
Money market mutual funds(1) ......................................... $200 $ 0
Investment in U.S. government and agency securities(2) ................... 0 1,177
Investment in corporate notes and bonds ............................... 0 7
Investment in FDIC-insured corporate bonds ............................ 0 209
Investment in asset and mortgage-backed securities ...................... 0 12
Forward foreign-exchange contracts, in asset position(3) ................... 0 1
Forward foreign-exchange contracts, in (liability) position(3) ................. 0 (2)
Total .......................................................... $200 $1,404
(1) Included in cash and cash equivalents in the accompanying consolidated balance sheets.
59