Costco 2012 Annual Report Download - page 31
Download and view the complete annual report
Please find page 31 of the 2012 Costco annual report below. You can navigate through the pages in the report by either clicking on the pages listed below, or by using the keyword search tool below to find specific information within the annual report.-
 1
1 -
2
-
3
-
4
-
5
-
6
-
7
-
8
-
9
-
10
-
11
-
12
-
13
-
14
-
15
-
16
-
17
-
18
-
19
-
20
-
 21
21 -
 22
22 -
 23
23 -
 24
24 -
 25
25 -
 26
26 -
 27
27 -
 28
28 -
 29
29 -
 30
30 -
 31
31 -
 32
32 -
 33
33 -
 34
34 -
 35
35 -
 36
36 -
 37
37 -
 38
38 -
 39
39 -
 40
40 -
 41
41 -
42
-
43
-
44
-
45
-
46
-
47
-
48
-
49
-
50
-
51
-
52
-
53
-
54
-
55
-
56
-
57
-
58
-
59
-
60
-
61
-
62
-
63
-
64
-
65
-
66
-
67
-
68
-
69
-
70
-
71
-
72
-
73
-
74
-
75
-
76
-
77
-
78
-
79
-
80
 |
 |

2011 vs. 2010
Net Sales
Net sales increased $10,793 or 14.2% during 2011 compared to 2010. Excluding sales of Mexico (not
consolidated in 2010), the increase would have been 11%. This increase was primarily attributable to
an increase in comparable warehouse sales, and the remainder primarily from sales at the 20 net new
warehouses opened during 2011.
Gasoline price inflation positively impacted net sales by approximately $1,699 or 223 basis points,
which resulted from a 24% increase in the average sales price per gallon during 2011. Changes in
foreign currencies relative to the U.S. dollar positively impacted net sales by approximately $1,308, or
172 basis points during 2011. The positive impact in 2011 was primarily due to positive impacts in the
exchange rates of the Canadian dollar, the Japanese yen and the Mexican peso of approximately
$728, $157 and $152, respectively.
Comparable Sales
Comparable sales, including Mexico for both 2011 and 2010, increased 10% during 2011, and were
positively impacted by increases in the average amount spent by our members and in their shopping
frequency. Gasoline price inflation and changes in foreign currencies relative to the U.S. dollar
positively impacted comparable sales results in 2011. The increase in comparable sales includes the
negative impact of cannibalization (established warehouses losing sales to our newly opened
locations).
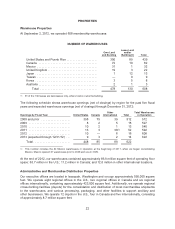
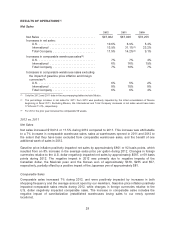
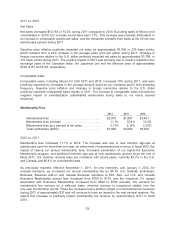
Membership Fees
2012 2011 2010
Membership fees ................................ $2,075 $1,867 $1,691
Membership fees increase ........................ 11.1% 10.4% 10.3%
Membership fees as a percent of net sales ........... 2.13% 2.15% 2.22%
Total cardholders (000’s) .......................... 67,000 64,000 58,000
2012 vs. 2011
Membership fees increased 11.1% in 2012. The increase was due to new member sign-ups at
warehouses open for more than one year, an extra week of membership fee revenue in fiscal 2012, the
impact of raising our annual membership fees, increased penetration of our higher-fee Executive
Membership program, and additional member sign-ups at new warehouses opened since the end of
fiscal 2011. Our member renewal rates are consistent with recent years, currently 89.7% in the U.S.
and Canada, and 86.4% on a worldwide basis.
As previously reported, effective November 1, 2011, for new members, and January 1, 2012, for
renewal members, we increased our annual membership fee by $5 for U.S. Goldstar (individual),
Business, Business add-on and Canada Business members to $55. Also, our U.S. and Canada
Executive Membership annual fees increased from $100 to $110, and the maximum 2% reward
associated with Executive Membership increased from $500 to $750 annually. We account for
membership fee revenue on a deferred basis, whereby revenue is recognized ratably over the
one-year membership period. These fee increases had a positive impact on membership fee revenues
during 2012 of approximately $37 and will continue to have an impact in the next several quarters. We
expect this increase to positively impact membership fee revenue by approximately $121 in fiscal
2013.
29