Costco 2012 Annual Report Download - page 64
Download and view the complete annual report
Please find page 64 of the 2012 Costco annual report below. You can navigate through the pages in the report by either clicking on the pages listed below, or by using the keyword search tool below to find specific information within the annual report.-
 1
1 -
2
-
3
-
4
-
5
-
6
-
7
-
8
-
9
-
10
-
11
-
12
-
13
-
14
-
15
-
16
-
17
-
18
-
19
-
20
-
21
-
22
-
23
-
24
-
25
-
26
-
27
-
28
-
29
-
30
-
31
-
32
-
33
-
34
-
35
-
36
-
37
-
38
-
39
-
40
-
41
-
42
-
43
-
44
-
45
-
46
-
47
-
48
-
49
-
50
-
51
-
52
-
53
-
 54
54 -
 55
55 -
 56
56 -
 57
57 -
 58
58 -
 59
59 -
 60
60 -
 61
61 -
 62
62 -
 63
63 -
 64
64 -
 65
65 -
 66
66 -
 67
67 -
 68
68 -
 69
69 -
 70
70 -
 71
71 -
 72
72 -
 73
73 -
 74
74 -
75
-
76
-
77
-
78
-
79
-
80
 |
 |

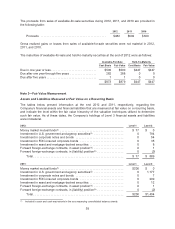
In August 1997, the Company sold $900 principal amount at maturity 3.5% Zero Coupon Convertible
Subordinated Notes (Zero Coupon Notes) due in August 2017. The Zero Coupon Notes were priced
with a yield to maturity of 3.5%, resulting in gross proceeds to the Company of $450. The remaining
Zero Coupon Notes outstanding are convertible into a maximum of 832,000 shares of Costco Common
Stock shares at an initial conversion price of $22.71. The Company, at its option, may redeem the Zero
Coupon Notes (at the discounted issue price plus accrued interest to date of redemption) any time after
August 2002. These notes are included in other long-term debt in the table above and are classified as
a Level 2 measurement in the fair value hierarchy. At the end of 2012, $864 in principal amount of Zero
Coupon Notes had been converted by note holders into shares of Costco Common Stock.
Maturities of long-term debt during the next five fiscal years and thereafter are as follows:
2013 ........................................................ $ 1
2014 ........................................................ 1
2015 ........................................................ 1
2016 ........................................................ 0
2017 ........................................................ 1,128
Thereafter ................................................... 251
Total .................................................... $1,382
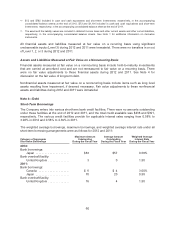
Note 5—Leases
Operating Leases
The aggregate rental expense for 2012, 2011 and 2010 was $220, $208, and $187, respectively.
Sublease income, included in interest income and other, net, and contingent rents are not material.
Capital Leases
Gross assets recorded under capital leases were $187 and $170, at the end of 2012 and 2011,
respectively. These assets are recorded net of accumulated amortization of $19 and $13 at the end of
2012 and 2011, respectively.
At the end of 2012, future minimum payments, net of sub-lease income of $177 for all years combined,
under non-cancelable operating leases with terms of at least one year and capital leases were as
follows:
Operating
Leases
Capital
Leases
2013 ...................................................... $ 189 $ 14
2014 ...................................................... 184 14
2015 ...................................................... 171 14
2016 ...................................................... 164 15
2017 ...................................................... 156 15
Thereafter ................................................. 1,883 328
Total .................................................. $2,747 400
Less amount representing interest ............................. (217)
Net present value of minimum lease payments ................... 183
Less current installments(1) .................................... (2)
Long-term capital lease obligations less current installments(2) ....... $181
(1) Included in other current liabilities.
(2) Included in deferred income taxes and other liabilities.
62