Costco 2012 Annual Report Download - page 35
Download and view the complete annual report
Please find page 35 of the 2012 Costco annual report below. You can navigate through the pages in the report by either clicking on the pages listed below, or by using the keyword search tool below to find specific information within the annual report.-
 1
1 -
2
-
3
-
4
-
5
-
6
-
7
-
8
-
9
-
10
-
11
-
12
-
13
-
14
-
15
-
16
-
17
-
18
-
19
-
20
-
21
-
22
-
23
-
24
-
 25
25 -
 26
26 -
 27
27 -
 28
28 -
 29
29 -
 30
30 -
 31
31 -
 32
32 -
 33
33 -
 34
34 -
 35
35 -
 36
36 -
 37
37 -
 38
38 -
 39
39 -
 40
40 -
 41
41 -
 42
42 -
 43
43 -
 44
44 -
 45
45 -
46
-
47
-
48
-
49
-
50
-
51
-
52
-
53
-
54
-
55
-
56
-
57
-
58
-
59
-
60
-
61
-
62
-
63
-
64
-
65
-
66
-
67
-
68
-
69
-
70
-
71
-
72
-
73
-
74
-
75
-
76
-
77
-
78
-
79
-
80
 |
 |

LIQUIDITY AND CAPITAL RESOURCES
Cash Flows
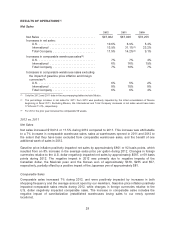
The following table itemizes components of our most liquid assets:
2012 2011
Cash and cash equivalents .................................. $3,528 $4,009
Short-term investments ...................................... 1,326 1,604
Total ................................................. $4,854 $5,613
Our primary sources of liquidity are cash flows generated from warehouse operations, cash and cash
equivalents and short-term investment balances. Of these balances, approximately $1,161 and $982 at
the end of 2012 and 2011, respectively, represented debit and credit card receivables, primarily related
to sales within the last week of our fiscal year.
Net cash provided by operating activities totaled $3,057 in 2012 compared to $3,198 in 2011, a
decrease of $141. This decrease was primarily attributable to an increase in our net investment in
merchandise inventories (change in merchandise inventories less changes in accounts payable) of
$314, an $87 decrease in deferred income taxes and a $38 decrease in other current operating assets
and liabilities. These items were partially offset by a $225 increase in net income including
noncontrolling interests, a $53 increase in depreciation and amortization and a $34 increase in stock-
based compensation.
Net cash used in investing activities totaled $1,236 in 2012 compared to $1,180 in 2011, an increase of
$56. This increase was primarily attributable to an increase of $190 used for property and equipment
additions in 2012 as compared to 2011. Additionally, in 2011, cash increased by $165 resulting from
the initial consolidation of Costco Mexico. These items were partially offset by net cash provided by
purchases, maturities and sales of investments of $255 in 2012, compared to net cash used by these
activities of $60 in 2011.
Net cash used in financing activities totaled $2,281 in 2012 compared to $1,277 in 2011, an increase of
$1,004. This increase was primarily attributable to the $900 repayment of our 5.3% Senior Notes (2012
Notes), and $789 used to purchase the noncontrolling interest in Costco Mexico from our joint venture
partner. In addition, proceeds from the exercise of stock options decreased $176 and our Mexico
subsidiary made a distribution to our former joint venture partner of $161. These items were partially
offset by an increase in bank checks outstanding of $971. In 2012 the increase in bank checks
outstanding was due to maintaining lower balances in banks on which our checks are drawn.
The effect of changes in foreign-exchange rates decreased cash and cash equivalents by $21 in 2012,
compared to an increase of $54 in 2011, a decrease of $75.
Management believes that our current cash position and operating cash flows will be sufficient to meet
our capital requirements for the foreseeable future. We have not provided for U.S. deferred taxes on
cumulative undistributed earnings of $3,162 and $2,646 at the end of 2012 and 2011, respectively, of
certain non-U.S. consolidated subsidiaries as such earnings are deemed by us to be indefinitely
reinvested. We believe that our U.S. current asset position is sufficient to meet our U.S. liquidity
requirements and have no current plans to repatriate for use in the U.S. the cash and cash equivalents
and short-term investments held by these subsidiaries. At September 2, 2012, cash and cash
equivalents and short-term investments totaling $2,039 were held by these non-U.S. consolidated
subsidiaries.
33