Costco 2012 Annual Report Download - page 3
Download and view the complete annual report
Please find page 3 of the 2012 Costco annual report below. You can navigate through the pages in the report by either clicking on the pages listed below, or by using the keyword search tool below to find specific information within the annual report.-
 1
1 -
 2
2 -
 3
3 -
 4
4 -
 5
5 -
 6
6 -
 7
7 -
 8
8 -
 9
9 -
 10
10 -
 11
11 -
 12
12 -
 13
13 -
 14
14 -
15
-
16
-
17
-
18
-
19
-
20
-
21
-
22
-
23
-
24
-
25
-
26
-
27
-
28
-
29
-
30
-
31
-
32
-
33
-
34
-
35
-
36
-
37
-
38
-
39
-
40
-
41
-
42
-
43
-
44
-
45
-
46
-
47
-
48
-
49
-
50
-
51
-
52
-
53
-
54
-
55
-
56
-
57
-
58
-
59
-
60
-
61
-
62
-
63
-
64
-
65
-
66
-
67
-
68
-
69
-
70
-
71
-
72
-
73
-
74
-
75
-
76
-
77
-
78
-
79
-
80
 |
 |

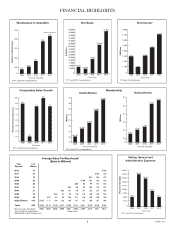
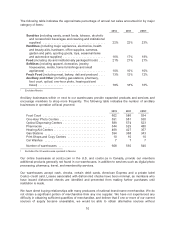
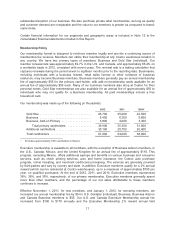
At Fiscal Year End
2008 2010
(622 at 12/31/12)
0
525
550
575
2011*
512
2012*
527
2009
540
592
608
600
625
Warehouses in Operation
*2011 and 2012 Include Mexico
Number of Warehouses
Percent Increase/Decrease
Fiscal Year
2008 2010 2011*
-4%
-2%
0%
2%
4%
6%
8%
10%
2012*
8%
10%
2009
-4%
7% 7%
Comparable Sales Growth
*2011 and 2012 Include Mexico
Fiscal Year
2008 2009
0
10.10%
10.20%
10.30%
10.40%
10.50%
9.90%
9.80%
10.00%
2010 2011* 2012*
9.70%
9.80% 9.81%
10.40%
10.29%
9.98%
Selling, General and
Administrative Expenses
*2011 and 2012 Include Mexico
At Fiscal Year End
2008 2010
5.5
5.7
5.9
6.1
6.3
6.5
0
2011*
5.594
2012*
5.719
2009
Business Members
At Fiscal Year End
Millions
Millions
2008 2010
0
2011*
20.181
2012*
22.539
24.845
26.736
2009
Gold Star Members
24
21
23
22 21.445
5.789
6.335
6.442
25
20
27
26
Membership
*2011 and 2012 Include Mexico
Year
Opened
# of
Whses
2012 15 $105
2011 21 $103 120
2010 13 $94 106 122
2009 20 $100 107 130 146
2008 26 $86 83 99 116 128
2007 31 $76 88 92 103 116 127
2006 27 $92 101 118 114 122 127 136
2005 18 $63 81 95 110 116 128 129 136
2004 22 $72 81 99 109 121 118 126 130 138
2003 & Before 415 $105 117 124 132 138 147 141 150 157 166
Totals 608 $105 $115 $120 $127 $130 $137 $131 $139 $146 $155
2003 2004 2005 2006 2007 2008 2009 2010 2011 2012
Fiscal Year
Average Sales Per Warehouse*
(Sales In Millions)
*First year sales annualized.
2011 and 2012 Include Mexico
2006 and 2012 were 53-week years.
Fiscal Year
2008 2010 2011* 2012*
74,000
78,000
80,000
82,000
84,000
86,000
88,000
90,000
92,000
94,000
2009
70,977
69,889
0
96,000
98,000
76,255
87,048
97,062
70,000
76,000
72,000
Net Sales
*2011 and 2012 Include Mexico
$ Millions
$ Millions
Fiscal Year
2008 2010
0
1,700
1,800
1,400
1,500
1,600
1,300
1,100
1,200
2011
1,283
2012
1,086
2009
1,303
1,462
1,709
Net Income*
*All Years Include Mexico
FINANCIAL HIGHLIGHTS
113C0106_C 10/12