Costco 2012 Annual Report Download - page 62
Download and view the complete annual report
Please find page 62 of the 2012 Costco annual report below. You can navigate through the pages in the report by either clicking on the pages listed below, or by using the keyword search tool below to find specific information within the annual report.-
 1
1 -
2
-
3
-
4
-
5
-
6
-
7
-
8
-
9
-
10
-
11
-
12
-
13
-
14
-
15
-
16
-
17
-
18
-
19
-
20
-
21
-
22
-
23
-
24
-
25
-
26
-
27
-
28
-
29
-
30
-
31
-
32
-
33
-
34
-
35
-
36
-
37
-
38
-
39
-
40
-
41
-
42
-
43
-
44
-
45
-
46
-
47
-
48
-
49
-
50
-
51
-
 52
52 -
 53
53 -
 54
54 -
 55
55 -
 56
56 -
 57
57 -
 58
58 -
 59
59 -
 60
60 -
 61
61 -
 62
62 -
 63
63 -
 64
64 -
 65
65 -
 66
66 -
 67
67 -
 68
68 -
 69
69 -
 70
70 -
 71
71 -
 72
72 -
73
-
74
-
75
-
76
-
77
-
78
-
79
-
80
 |
 |

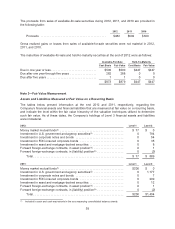
(2) $12 and $782 included in cash and cash equivalents and short-term investments, respectively, in the accompanying
consolidated balance sheets at the end of 2012. $73 and $1,104 included in cash and cash equivalents and short-term
investments, respectively, in the accompanying consolidated balance sheet at the end of 2011.
(3) The asset and the liability values are included in deferred income taxes and other current assets and other current liabilities,
respectively, in the accompanying consolidated balance sheets. See Note 1 for additional information on derivative
instruments.
All financial assets and liabilities measured at fair value on a recurring basis using significant
unobservable inputs (Level 3) during 2012 and 2011 were immaterial. There were no transfers in or out
of Level 1, 2, or 3 during 2012 and 2011.
Assets and Liabilities Measured at Fair Value on a Nonrecurring Basis
Financial assets measured at fair value on a nonrecurring basis include held-to-maturity investments
that are carried at amortized cost and are not remeasured to fair value on a recurring basis. There
were no fair value adjustments to these financial assets during 2012 and 2011. See Note 4 for
discussion on the fair value of long-term debt.
Nonfinancial assets measured at fair value on a nonrecurring basis include items such as long lived
assets resulting from impairment, if deemed necessary. Fair value adjustments to these nonfinancial
assets and liabilities during 2012 and 2011 were immaterial.
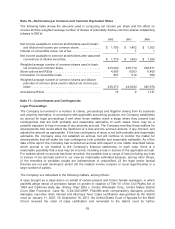
Note 4—Debt
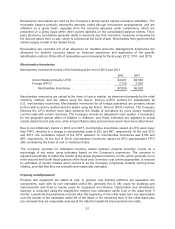
Short-Term Borrowings
The Company enters into various short-term bank credit facilities. There were no amounts outstanding
under these facilities at the end of 2012 and 2011, and the total credit available was $438 and $391,
respectively. The various credit facilities provide for applicable interest rates ranging from 0.58% to
3.96% in 2012 and 0.58% to 4.39% in 2011.
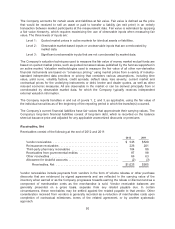
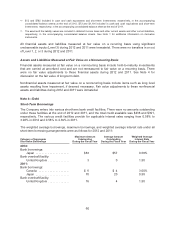
The weighted average borrowings, maximum borrowings, and weighted average interest rate under all
short-term borrowing arrangements were as follows for 2012 and 2011:
Category of Aggregate
Short-term Borrowings
Maximum Amount
Outstanding
During the Fiscal Year
Average Amount
Outstanding
During the Fiscal Year
Weighted Average
Interest Rate
During the Fiscal Year
2012:
Bank borrowings:
Japan ...................... $83 $57 0.58%
Bank overdraft facility:
United Kingdom .............. 3 0 1.50
2011:
Bank borrowings:
Canada .................... $ 6 $ 4 3.00%
Japan ...................... 70 20 0.58
Bank overdraft facility:
United Kingdom .............. 16 4 1.50
60