Costco 2012 Annual Report Download - page 67
Download and view the complete annual report
Please find page 67 of the 2012 Costco annual report below. You can navigate through the pages in the report by either clicking on the pages listed below, or by using the keyword search tool below to find specific information within the annual report.-
 1
1 -
2
-
3
-
4
-
5
-
6
-
7
-
8
-
9
-
10
-
11
-
12
-
13
-
14
-
15
-
16
-
17
-
18
-
19
-
20
-
21
-
22
-
23
-
24
-
25
-
26
-
27
-
28
-
29
-
30
-
31
-
32
-
33
-
34
-
35
-
36
-
37
-
38
-
39
-
40
-
41
-
42
-
43
-
44
-
45
-
46
-
47
-
48
-
49
-
50
-
51
-
52
-
53
-
54
-
55
-
56
-
 57
57 -
 58
58 -
 59
59 -
 60
60 -
 61
61 -
 62
62 -
 63
63 -
 64
64 -
 65
65 -
 66
66 -
 67
67 -
 68
68 -
 69
69 -
 70
70 -
 71
71 -
 72
72 -
 73
73 -
 74
74 -
 75
75 -
 76
76 -
 77
77 -
78
-
79
-
80
 |
 |

Employee Tax Consequences on Certain Stock Options
In 2010, the Company recorded a non-recurring benefit of $24 to selling, general and administrative
expense related to a refund of a previously recorded Canadian employee tax liability.
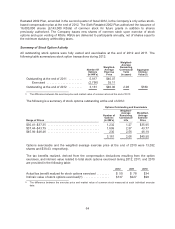
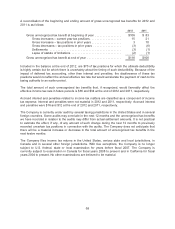
Summary of Restricted Stock Unit Activity
RSUs granted to employees and to non-employee directors generally vest over five years and three
years, respectively; however, the Company provides for accelerated vesting for employees and
non-employee directors that have attained twenty-five or more years and five or more years of service
with the Company, respectively. Recipients are not entitled to vote or receive dividends on non-vested
and undelivered shares. At the end of 2012, 14,345,000 shares were available to be granted as RSUs
under the Sixth Restated 2002 Plan.
The following awards were outstanding at the end of 2012:
• 8,558,000 time-based RSUs that vest upon continued employment over specified periods of
time;
• 702,000 performance-based RSUs, of which 304,000 will be formally granted to certain
executive officers of the Company upon the official certification of the attainment of specified
performance targets for 2012. Once formally granted, the restrictions lapse upon continued
employment over specified periods of time.
The following table summarizes RSU transactions during 2012:
Number of
Units
(in 000’s)
Weighted-Average
Grant Date Fair
Value
Non-vested at the end of 2011 ................... 9,727 $57.56
Granted ................................. 3,593 81.55
Vested and delivered ....................... (3,819) 58.97
Forfeited ................................. (241) 65.54
Non-vested at the end of 2012 ................... 9,260 $66.14
The remaining unrecognized compensation cost related to non-vested RSUs at the end of 2012 was
$422 and the weighted-average period of time over which this cost will be recognized is 1.7 years. At
the end of 2012, there were approximately 2,900,000 RSUs vested, but not yet delivered.
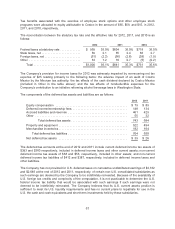
Summary of Stock-Based Compensation
The following table summarizes stock-based compensation expense and the related tax benefits under
the Company’s plans:
2012 2011 2010
RSUs ..................................................... $241 $206 $171
Stock options ............................................... 0 1 19
Total stock-based compensation expense before income taxes ...... 241 207 190
Less recognized income tax benefit ............................ 79 67 63
Total stock-based compensation expense, net of income taxes ...... $162 $140 $127
65