Cigna 2012 Annual Report Download - page 79
Download and view the complete annual report
Please find page 79 of the 2012 Cigna annual report below. You can navigate through the pages in the report by either clicking on the pages listed below, or by using the keyword search tool below to find specific information within the annual report.-
 1
1 -
2
-
3
-
4
-
5
-
6
-
7
-
8
-
9
-
10
-
11
-
12
-
13
-
14
-
15
-
16
-
17
-
18
-
19
-
20
-
21
-
22
-
23
-
24
-
25
-
26
-
27
-
28
-
29
-
30
-
31
-
32
-
33
-
34
-
35
-
36
-
37
-
38
-
39
-
40
-
41
-
42
-
43
-
44
-
45
-
46
-
47
-
48
-
49
-
50
-
51
-
52
-
53
-
54
-
55
-
56
-
57
-
58
-
59
-
60
-
61
-
62
-
63
-
64
-
65
-
66
-
67
-
68
-
 69
69 -
 70
70 -
 71
71 -
 72
72 -
 73
73 -
 74
74 -
 75
75 -
 76
76 -
 77
77 -
 78
78 -
 79
79 -
 80
80 -
 81
81 -
 82
82 -
 83
83 -
 84
84 -
 85
85 -
 86
86 -
 87
87 -
 88
88 -
 89
89 -
90
-
91
-
92
-
93
-
94
-
95
-
96
-
97
-
98
-
99
-
100
-
101
-
102
-
103
-
104
-
105
-
106
-
107
-
108
-
109
-
110
-
111
-
112
-
113
-
114
-
115
-
116
-
117
-
118
-
119
-
120
-
121
-
122
-
123
-
124
-
125
-
126
-
127
-
128
-
129
-
130
-
131
-
132
-
133
-
134
-
135
-
136
-
137
-
138
-
139
-
140
-
141
-
142
-
143
-
144
-
145
-
146
-
147
-
148
-
149
-
150
-
151
-
152
-
153
-
154
-
155
-
156
-
157
-
158
-
159
-
160
-
161
-
162
-
163
-
164
-
165
-
166
-
167
-
168
-
169
-
170
-
171
-
172
-
173
-
174
-
175
-
176
-
177
-
178
-
179
-
180
-
181
-
182
 |
 |

PART II
ITEM 7 Management’s Discussion and Analysis of Financial Condition and Results of Operations
and Hong Kong. Foreign government obligations also include $1 million in countries with the most significant political or economic
$167 million of investments in European sovereign debt, including concerns.
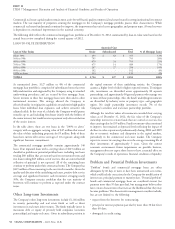
The Company’s investment in state and local government securities is diversified by issuer and geography with no single exposure greater than
$34 million. The Company assesses each issuer’s credit quality based on a fundamental analysis of underlying financial information and does not
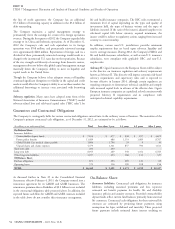
rely solely on statistical rating organizations or monoline insurer guarantees. As of December 31, 2012, 97% of the Company’s investments in
these securities were rated A3 or better excluding guarantees by monoline bond insurers, consistent with December 31, 2011. As of December 31,
2012, approximately 63% or $1,538 million of the Company’s total investments in state and local government securities were guaranteed by
monoline bond insurers, providing additional credit quality support. The quality ratings of these investments with and without this guaranteed
support as of December 31, 2012 were as follows:
As of December 31, 2012
Fair Value
(In millions)
Quality Rating With Guarantee Without Guarantee
State and local governments Aaa $ 131 $ 130
Aa1-Aa3 1,108 1,037
A1-A3 259 328
Baa1-Baa3 40 20
Ba1-Ba3 - 23
Not available - -
TOTAL STATE AND LOCAL GOVERNMENTS $ 1,538 $ 1,538
As of December 31, 2012, the Company’s investments in other asset rating of BAA- that are guaranteed by monoline bond insurers.
and mortgage-backed securities totaling $1,148 million included Quality ratings without considering the guarantees for these other
$508 million of private placement securities with an average quality asset-backed securities were not available.
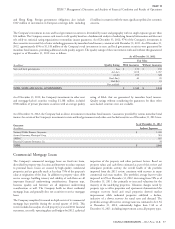
As of December 31, 2012, the Company had no direct investments in monoline bond insurers. Guarantees provided by various monoline bond
insurers for certain of the Company’s investments in state and local governments and other asset-backed securities as of December 31, 2012 were:
As of December 31, 2012
Guarantor
(In millions)
Indirect Exposure
National Public Finance Guarantee $ 1,240
Assured Guaranty Municipal Corp 583
AMBAC 185
Financial Guaranty Insurance Co. 38
TOTAL $ 2,046
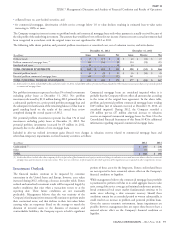
Commercial Mortgage Loans
The Company’s commercial mortgage loans are fixed rate loans, inspection of the property and other pertinent factors. Based on
diversified by property type, location and borrower to reduce exposure property values and cash flows estimated as part of this review and
to potential losses. Loans are secured by high quality commercial subsequent portfolio activity, the overall health of the portfolio
properties and are generally made at less than 75% of the property’s improved from the 2011 review, consistent with recovery in many
value at origination of the loan. In addition to property value, debt commercial real estate markets. The portfolio’s average loan-to-value
service coverage, building tenancy and stability of cash flows are all improved to 65% at December 31, 2012, decreasing from 70% as of
important financial underwriting considerations. Property type, December 31, 2011, due primarily to increased valuations for the
location, quality, and borrower are all important underwriting majority of the underlying properties. Valuation changes varied by
considerations as well. The Company holds no direct residential property type as office properties and apartments demonstrated the
mortgage loans and generally does not securitize or service mortgage strongest recovery, hotel and retail properties showed modest
loans. improvement while industrial properties exhibited a decline,
indicative of a slower recovery for rental rates and demand. The
The Company completed its annual in depth review of its commercial portfolio’s average debt service coverage ratio was estimated to be 1.56
mortgage loan portfolio during the second quarter of 2012. This at December 31, 2012, substantially higher than 1.40 as of
review included an analysis of each property’s year-end 2011 financial December 31, 2011, including improvement across all property types.
statements, rent rolls, operating plans and budgets for 2012, a physical
CIGNA CORPORATION - 2012 Form 10-K 57