Cigna 2012 Annual Report Download - page 64
Download and view the complete annual report
Please find page 64 of the 2012 Cigna annual report below. You can navigate through the pages in the report by either clicking on the pages listed below, or by using the keyword search tool below to find specific information within the annual report.-
 1
1 -
2
-
3
-
4
-
5
-
6
-
7
-
8
-
9
-
10
-
11
-
12
-
13
-
14
-
15
-
16
-
17
-
18
-
19
-
20
-
21
-
22
-
23
-
24
-
25
-
26
-
27
-
28
-
29
-
30
-
31
-
32
-
33
-
34
-
35
-
36
-
37
-
38
-
39
-
40
-
41
-
42
-
43
-
44
-
45
-
46
-
47
-
48
-
49
-
50
-
51
-
52
-
53
-
 54
54 -
 55
55 -
 56
56 -
 57
57 -
 58
58 -
 59
59 -
 60
60 -
 61
61 -
 62
62 -
 63
63 -
 64
64 -
 65
65 -
 66
66 -
 67
67 -
 68
68 -
 69
69 -
 70
70 -
 71
71 -
 72
72 -
 73
73 -
 74
74 -
75
-
76
-
77
-
78
-
79
-
80
-
81
-
82
-
83
-
84
-
85
-
86
-
87
-
88
-
89
-
90
-
91
-
92
-
93
-
94
-
95
-
96
-
97
-
98
-
99
-
100
-
101
-
102
-
103
-
104
-
105
-
106
-
107
-
108
-
109
-
110
-
111
-
112
-
113
-
114
-
115
-
116
-
117
-
118
-
119
-
120
-
121
-
122
-
123
-
124
-
125
-
126
-
127
-
128
-
129
-
130
-
131
-
132
-
133
-
134
-
135
-
136
-
137
-
138
-
139
-
140
-
141
-
142
-
143
-
144
-
145
-
146
-
147
-
148
-
149
-
150
-
151
-
152
-
153
-
154
-
155
-
156
-
157
-
158
-
159
-
160
-
161
-
162
-
163
-
164
-
165
-
166
-
167
-
168
-
169
-
170
-
171
-
172
-
173
-
174
-
175
-
176
-
177
-
178
-
179
-
180
-
181
-
182
 |
 |
PART II
ITEM 7 Management’s Discussion and Analysis of Financial Condition and Results of Operations
revenue growth in the U.S. commercial business, primarily due to a average membership in the guaranteed cost and ASO commercial
higher ASO customer base resulting in higher fees, as well as businesses, particularly in the targeted market segments: Middle,
additional sales of stop loss and specialty products; Select and Individual;
growth in the international health care business; and strong revenue growth in the international health care business;
increased specialty margins including behavioral and pharmacy growth in specialty revenues, as well as rate increases on most
products. products consistent with underlying trend;
These favorable impacts were partially offset by: a lower guaranteed cost medical care ratio and higher experience-
rated margins in the commercial business driven by low medical
higher operating expenses, primarily attributable to investments in services utilization trend, as well as favorable prior year claim
technology and initiatives to expand business capabilities as well as development. These favorable effects were partially offset by the
to support business growth; and estimated cost of premium rebates calculated under the minimum
medical loss ratio requirements of Health Care Reform; and
modestly higher medical care ratios in our commercial risk
businesses due to slightly higher utilization. higher net investment income of 14% in 2011, primarily reflecting
increased average asset levels driven by membership growth, as well
The Global Health Care segment’s adjusted income from operations
as higher income from partnership investments.
increased 17% in 2011, as compared with 2010 reflecting:
growth in premiums and fees of 9% in 2011 (excluding the impact
of exiting the Medicare IPFFS business), primarily due to higher
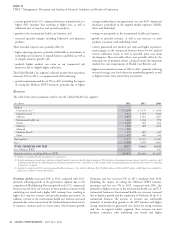
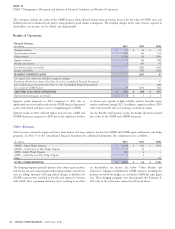
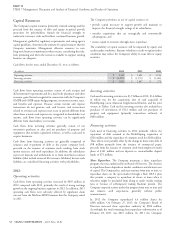
Revenues
The table below shows premiums and fees for the Global Health Care segment:
(In millions)
2012 2011 2010
Medical:
Guaranteed cost
(1)
$ 4,256 $ 4,176 $ 3,929
Experience-rated
(2)
2,022 1,934 1,823
Stop loss 1,672 1,451 1,287
International health care 1,648 1,344 976
Dental 1,005 894 804
Medicare 4,969 489 1,470
Medicaid 207 - -
Medicare Part D 1,421 685 615
Other 677 600 543
Total medical 17,877 11,573 11,447
Fees
(3)
3,096 2,870 2,687
TOTAL PREMIUMS AND FEES 20,973 14,443 14,134
Less: Medicare IPFFS - - 827
Premiums and fees, excluding Medicare IPFFS $ 20,973 $ 14,443 $ 13,307
(1) Excludes international health care guaranteed cost premiums.
(2) Includes minimum premium business that has a risk profile similar to experience-rated funding arrangements. The risk portion of minimum premium revenue is reported in experience-rated
medical premium whereas the self funding portion of minimum premium revenue is reported in fees. Also, includes certain non-participating cases for which special customer level reporting
of experience is required.
(3) Includes fees related to the U.S. and international health care businesses. Fees related to Medicare Part D of $61 million in 2011 and $57 million in 2010 have been reclassified to
premiums to conform to current presentation.
Premiums and fees increased 45% in 2012, compared with 2011, Premiums and fees increased 2% in 2011 compared with 2010.
primarily reflecting growth in the government segment due to the Excluding the impact of exiting the Medicare IPFFS business,
acquisition of HealthSpring. Revenue growth in the U.S. commercial premiums and fees rose 9% in 2011, compared with 2010, due
business was driven by rate increases on most products consistent with primarily to higher revenues in the international health care and U.S.
underlying cost trends and a higher ASO customer base, resulting in commercial businesses. International health care revenues increased
higher fees, stop loss revenues and specialty product penetration. In due to business growth and the acquisition of Vanbreda. In the U.S.
addition, revenue in the international health care business increased commercial business, the increase in revenues was attributable
primarily due to the conversion of the Vanbreda business from service primarily to membership growth in the ASO business and higher
to insurance contracts and, to a lesser extent, other business growth. average membership in guaranteed cost, driven by strong retention
and sales in targeted market segments. Rate increases on most
products consistent with underlying cost trends and higher
42 CIGNA CORPORATION - 2012 Form 10-K
•
••
••
•
•
•
•
•