Cigna 2012 Annual Report Download - page 115
Download and view the complete annual report
Please find page 115 of the 2012 Cigna annual report below. You can navigate through the pages in the report by either clicking on the pages listed below, or by using the keyword search tool below to find specific information within the annual report.-
 1
1 -
2
-
3
-
4
-
5
-
6
-
7
-
8
-
9
-
10
-
11
-
12
-
13
-
14
-
15
-
16
-
17
-
18
-
19
-
20
-
21
-
22
-
23
-
24
-
25
-
26
-
27
-
28
-
29
-
30
-
31
-
32
-
33
-
34
-
35
-
36
-
37
-
38
-
39
-
40
-
41
-
42
-
43
-
44
-
45
-
46
-
47
-
48
-
49
-
50
-
51
-
52
-
53
-
54
-
55
-
56
-
57
-
58
-
59
-
60
-
61
-
62
-
63
-
64
-
65
-
66
-
67
-
68
-
69
-
70
-
71
-
72
-
73
-
74
-
75
-
76
-
77
-
78
-
79
-
80
-
81
-
82
-
83
-
84
-
85
-
86
-
87
-
88
-
89
-
90
-
91
-
92
-
93
-
94
-
95
-
96
-
97
-
98
-
99
-
100
-
101
-
102
-
103
-
104
-
 105
105 -
 106
106 -
 107
107 -
 108
108 -
 109
109 -
 110
110 -
 111
111 -
 112
112 -
 113
113 -
 114
114 -
 115
115 -
 116
116 -
 117
117 -
 118
118 -
 119
119 -
 120
120 -
 121
121 -
 122
122 -
 123
123 -
 124
124 -
 125
125 -
126
-
127
-
128
-
129
-
130
-
131
-
132
-
133
-
134
-
135
-
136
-
137
-
138
-
139
-
140
-
141
-
142
-
143
-
144
-
145
-
146
-
147
-
148
-
149
-
150
-
151
-
152
-
153
-
154
-
155
-
156
-
157
-
158
-
159
-
160
-
161
-
162
-
163
-
164
-
165
-
166
-
167
-
168
-
169
-
170
-
171
-
172
-
173
-
174
-
175
-
176
-
177
-
178
-
179
-
180
-
181
-
182
 |
 |

PART II
ITEM 8 Financial Statements and Supplementary Data
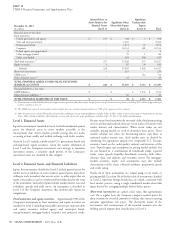
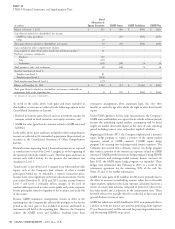
The Company is responsible for determining fair value, as well as the appropriate estimates of fair value. These analyses include reviewing
appropriate level within the fair value hierarchy, based on the to ensure that prices do not become stale and whether changes from
significance of unobservable inputs. The Company reviews prior valuations are reasonable or require additional review. The
methodologies and processes of third-party pricing services and Company also performs sample testing of sales values to confirm the
compares prices on a test basis to those obtained from other external accuracy of prior fair value estimates. Exceptions identified during
pricing sources or internal estimates. The Company performs ongoing these processes indicate that adjustments to prices are infrequent and
analyses of both prices received from third-party pricing services and do not significantly impact valuations.
those developed internally to determine that they represent
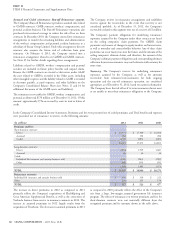
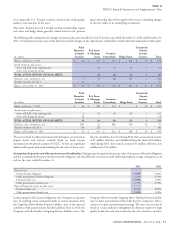
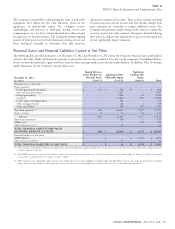
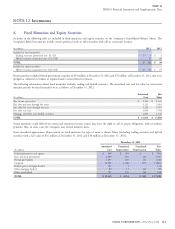
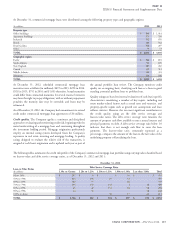
Financial Assets and Financial Liabilities Carried at Fair Value
The following tables provide information as of December 31, 2012 and December 31, 2011 about the Company’s financial assets and liabilities
carried at fair value. Similar disclosures for separate account assets, that are also recorded at fair value on the Company’s Consolidated Balance
Sheets, are provided separately as gains and losses related to these assets generally accrue directly to policyholders. In addition, Note 10 contains
similar disclosures for the Company’s pension plan assets.
Quoted Prices in Significant
Active Markets for Significant Other Unobservable
Identical Assets Observable Inputs Inputs
December 31, 2012
(In millions)
(Level 1) (Level 2) (Level 3) Total
Financial assets at fair value:
Fixed maturities:
Federal government and agency $ 156 $ 746 $ - $ 902
State and local government - 2,437 - 2,437
Foreign government - 1,298 24 1,322
Corporate - 11,201 695 11,896
Federal agency mortgage-backed - 122 - 122
Other mortgage-backed - 88 1 89
Other asset-backed - 340 597 937
Total fixed maturities
(1)
156 16,232 1,317 17,705
Equity securities 4 73 34 111
Subtotal 160 16,305 1,351 17,816
Short-term investments - 154 - 154
GMIB assets
(2)
- - 622 622
Other derivative assets
(3)
-41-41
TOTAL FINANCIAL ASSETS AT FAIR VALUE,
EXCLUDING SEPARATE ACCOUNTS $ 160 $ 16,500 $ 1,973 $ 18,633
Financial liabilities at fair value:
GMIB liabilities $ - $ - $ 1,170 $ 1,170
Other derivative liabilities
(3)
-31-31
TOTAL FINANCIAL LIABILITIES AT FAIR VALUE $ - $ 31 $ 1,170 $ 1,201
(1) Fixed maturities included $875 million of net appreciation required to adjust future policy benefits for the run-off settlement annuity business including $108 million of appreciation for
securities classified in Level 3.
(2) The GMIB assets represent retrocessional contracts in place from two external reinsurers that cover 55% of the exposures on these contracts. Effective February 4, 2013, the Company
reinsured the remaining 45% of the exposures on these contracts.
(3) Other derivative assets included $5 million of interest rate and foreign currency swaps qualifying as cash flow hedges and $36 million of interest rate swaps not designated as accounting
hedges. Other derivative liabilities reflected foreign currency and interest rate swaps qualifying as cash flow hedges. See Note 13 for additional information.
CIGNA CORPORATION - 2012 Form 10-K 93