Cigna 2012 Annual Report Download - page 78
Download and view the complete annual report
Please find page 78 of the 2012 Cigna annual report below. You can navigate through the pages in the report by either clicking on the pages listed below, or by using the keyword search tool below to find specific information within the annual report.-
 1
1 -
2
-
3
-
4
-
5
-
6
-
7
-
8
-
9
-
10
-
11
-
12
-
13
-
14
-
15
-
16
-
17
-
18
-
19
-
20
-
21
-
22
-
23
-
24
-
25
-
26
-
27
-
28
-
29
-
30
-
31
-
32
-
33
-
34
-
35
-
36
-
37
-
38
-
39
-
40
-
41
-
42
-
43
-
44
-
45
-
46
-
47
-
48
-
49
-
50
-
51
-
52
-
53
-
54
-
55
-
56
-
57
-
58
-
59
-
60
-
61
-
62
-
63
-
64
-
65
-
66
-
67
-
 68
68 -
 69
69 -
 70
70 -
 71
71 -
 72
72 -
 73
73 -
 74
74 -
 75
75 -
 76
76 -
 77
77 -
 78
78 -
 79
79 -
 80
80 -
 81
81 -
 82
82 -
 83
83 -
 84
84 -
 85
85 -
 86
86 -
 87
87 -
 88
88 -
89
-
90
-
91
-
92
-
93
-
94
-
95
-
96
-
97
-
98
-
99
-
100
-
101
-
102
-
103
-
104
-
105
-
106
-
107
-
108
-
109
-
110
-
111
-
112
-
113
-
114
-
115
-
116
-
117
-
118
-
119
-
120
-
121
-
122
-
123
-
124
-
125
-
126
-
127
-
128
-
129
-
130
-
131
-
132
-
133
-
134
-
135
-
136
-
137
-
138
-
139
-
140
-
141
-
142
-
143
-
144
-
145
-
146
-
147
-
148
-
149
-
150
-
151
-
152
-
153
-
154
-
155
-
156
-
157
-
158
-
159
-
160
-
161
-
162
-
163
-
164
-
165
-
166
-
167
-
168
-
169
-
170
-
171
-
172
-
173
-
174
-
175
-
176
-
177
-
178
-
179
-
180
-
181
-
182
 |
 |

PART II
ITEM 7 Management’s Discussion and Analysis of Financial Condition and Results of Operations
Investment Assets
The Company’s investment assets do not include separate account hypothetical market participant would use to determine a current
assets. Additional information regarding the Company’s investment transaction price. These valuation techniques involve some level of
assets and related accounting policies is included in Notes 2, 11, 12, estimation and judgment that becomes significant with increasingly
13, 14, 15 and 18 to the Consolidated Financial Statements. complex instruments or pricing models.
The Company is responsible for determining fair value, as well as the
Fixed Maturities
appropriate level within the fair value hierarchy as defined in Note 11
to the Consolidated Financial Statements, based on the significance of
Investments in fixed maturities include publicly traded and privately unobservable inputs. The Company reviews methodologies and
placed debt securities, mortgage and other asset-backed securities, processes of third-party pricing services and compares prices on a test
preferred stocks redeemable by the investor and hybrid and trading basis to those obtained from other external pricing sources or internal
securities. The Company estimates fair values using prices from third estimates. The Company performs ongoing analyses of both prices
parties or internal pricing methods. Fair value estimates received from received from third-party pricing services and those developed
third-party pricing services are based on reported trade activity and internally to determine that they represent appropriate estimates of
quoted market prices when available, and other market information fair value. These analyses include reviewing to ensure that prices do
that a market participant may use to estimate fair value. Internal not become stale and whether changes from prior valuations are
pricing methods are performed by the Company’s investment reasonable or require additional review. The Company also performs
professionals, and generally involve using discounted cash flow sample testing of sales values to confirm the accuracy of prior fair
analyses, incorporating current market inputs for similar financial value estimates. Exceptions identified during these processes indicate
instruments with comparable terms and credit quality, as well as other that adjustments to prices are infrequent and do not significantly
qualitative factors. In instances where there is little or no market impact valuations.
activity for the same or similar instruments, fair value is estimated
using methods, models and assumptions that the Company believes a
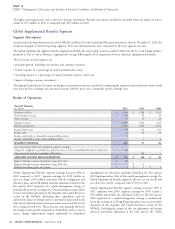
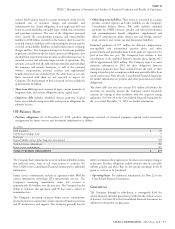
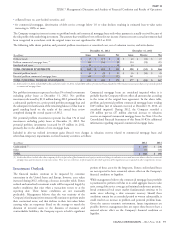
The Company’s fixed maturity portfolio continues to be diversified by issuer and industry type with the consumer sector representing the largest
single industry concentration of approximately 10% of total invested assets as of December 31, 2012.
(In millions)
2012 2011
Federal government and agency $ 902 $ 958
State and local government 2,437 2,456
Foreign government 1,322 1,274
Corporate 11,896 10,513
Federal agency mortgage-backed 122 9
Other mortgage-backed 89 80
Other asset-backed 937 927
TOTAL $ 17,705 $ 16,217
As of December 31, 2012, $15.9 billion, or 90%, of the fixed on publicly-traded bonds with comparable credit risk. The Company
maturities in the Company’s investment portfolio were investment performs a credit analysis of each issuer, diversifies investments by
grade (Baa and above, or equivalent), and the remaining $1.8 billion industry and issuer and requires financial and other covenants that
were below investment grade. The majority of the bonds that are allow the Company to monitor issuers for deteriorating financial
below investment grade are rated at the higher end of the strength and pursue remedial actions, if warranted. Also included in
non-investment grade spectrum. These quality characteristics have corporate fixed maturities are investments in companies that are
not materially changed during the year. domiciled or have significant business interests in European countries
with the most significant political or economic concerns (Portugal,
The net appreciation of the Company’s fixed maturity portfolio Italy, Ireland, Greece and Spain). Fixed maturity investments in these
increased $264 million during 2012, driven by a decrease in market companies represent approximately $400 million at December 31,
yields. Although asset values are well in excess of amortized cost, there 2012, have an average quality rating of BAA and are diversified by
are specific securities with amortized cost in excess of fair value by industry sector. Financial institutions comprised less than 2% of
approximately $30 million in aggregate as of December 31, 2012. See investments in these companies.
Note 12 to the Consolidated Financial Statements for further
information. The Company invests in high quality foreign government obligations,
with an average quality rating of AA as of December 31, 2012. These
Corporate fixed maturities includes private placement investments of investments are primarily concentrated in Asia consistent with the
$5.4 billion, which are generally less marketable than publicly-traded geographic distribution of the international business operations,
bonds, but yields on these investments tend to be higher than yields including government obligations of South Korea, Indonesia, Taiwan
56 CIGNA CORPORATION - 2012 Form 10-K