Cigna 2012 Annual Report Download - page 57
Download and view the complete annual report
Please find page 57 of the 2012 Cigna annual report below. You can navigate through the pages in the report by either clicking on the pages listed below, or by using the keyword search tool below to find specific information within the annual report.-
 1
1 -
2
-
3
-
4
-
5
-
6
-
7
-
8
-
9
-
10
-
11
-
12
-
13
-
14
-
15
-
16
-
17
-
18
-
19
-
20
-
21
-
22
-
23
-
24
-
25
-
26
-
27
-
28
-
29
-
30
-
31
-
32
-
33
-
34
-
35
-
36
-
37
-
38
-
39
-
40
-
41
-
42
-
43
-
44
-
45
-
46
-
 47
47 -
 48
48 -
 49
49 -
 50
50 -
 51
51 -
 52
52 -
 53
53 -
 54
54 -
 55
55 -
 56
56 -
 57
57 -
 58
58 -
 59
59 -
 60
60 -
 61
61 -
 62
62 -
 63
63 -
 64
64 -
 65
65 -
 66
66 -
 67
67 -
68
-
69
-
70
-
71
-
72
-
73
-
74
-
75
-
76
-
77
-
78
-
79
-
80
-
81
-
82
-
83
-
84
-
85
-
86
-
87
-
88
-
89
-
90
-
91
-
92
-
93
-
94
-
95
-
96
-
97
-
98
-
99
-
100
-
101
-
102
-
103
-
104
-
105
-
106
-
107
-
108
-
109
-
110
-
111
-
112
-
113
-
114
-
115
-
116
-
117
-
118
-
119
-
120
-
121
-
122
-
123
-
124
-
125
-
126
-
127
-
128
-
129
-
130
-
131
-
132
-
133
-
134
-
135
-
136
-
137
-
138
-
139
-
140
-
141
-
142
-
143
-
144
-
145
-
146
-
147
-
148
-
149
-
150
-
151
-
152
-
153
-
154
-
155
-
156
-
157
-
158
-
159
-
160
-
161
-
162
-
163
-
164
-
165
-
166
-
167
-
168
-
169
-
170
-
171
-
172
-
173
-
174
-
175
-
176
-
177
-
178
-
179
-
180
-
181
-
182
 |
 |

PART II
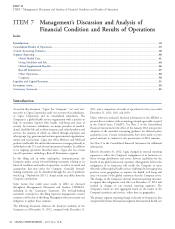
ITEM 7 Management’s Discussion and Analysis of Financial Condition and Results of Operations
Consolidated Results of Operations – Executive Summary
The Company measures the financial results of its segments using viewed as a substitute for the most directly comparable GAAP
‘‘segment earnings (loss)’’, that is defined as shareholders’ net income measure, that is shareholders’ net income.
(loss) before after-tax realized investment results. Adjusted income The Company excludes special items because management does not
(loss) from operations is defined as consolidated segment earnings believe they are representative of the Company’s underlying results of
(loss) excluding special items (described in the table below) and the operations. The Company also excludes the results of the GMIB
results of the GMIB business. Adjusted income (loss) from operations business because the changes in the fair value of GMIB assets and
is another measure of profitability used by the Company’s liabilities are volatile and unpredictable. See the Run-off Reinsurance
management because it presents the underlying results of operations section of the MD&A for additional information on GMIB. Because
of the Company’s businesses and permits analysis of trends in of this volatility, and since the GMIB business is in run-off,
underlying revenue, expenses and shareholders’ net income. This management does not believe that its results are meaningful in
measure is not determined in accordance with accounting principles assessing underlying results of operations.
generally accepted in the United States (‘‘GAAP’’) and should not be
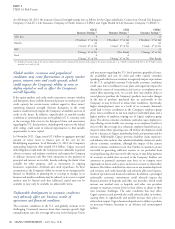
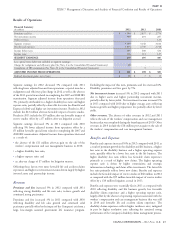
Summarized below is a reconciliation between shareholders’ income from continuing operations and adjusted income from operations.
Financial Summary
(In millions)
2012 2011 2010
Premiums and fees $ 26,187 $ 18,966 $ 18,274
Net investment income 1,144 1,146 1,105
Mail order pharmacy revenues 1,623 1,447 1,420
Other revenues 121 244 254
Realized investment gains 44 62 75
Total revenues 29,119 21,865 21,128
Benefits and expenses 26,642 19,989 19,326
Income before income taxes 2,477 1,876 1,802
Income taxes 853 615 519
Net income 1,624 1,261 1,283
Less: net income attributable to redeemable noncontrolling interest 1 - -
Less: net income attributable to other noncontrolling interest - 1 4
Shareholders’ net income 1,623 1,260 1,279
Less: realized investment gains, net of taxes 31 41 50
SEGMENT EARNINGS 1,592 1,219 1,229
Less: adjustments to reconcile to adjusted income from operations:
Results of GMIB business (after-tax) 29 (135) (24)
Special items (after-tax):
Charge for realignment and efficiency plan (See Note 6 to the Consolidated Financial Statements) (50) - -
Costs associated with acquisitions (See Note 3 to the Consolidated Financial Statements) (40) (31) -
Resolution of a federal tax matter (See Note 20 to the Consolidated Financial Statements) - - 101
Loss on early extinguishment of debt (See Note 16 to the Consolidated Financial Statements) - - (39)
Loss on reinsurance transaction (See Note 3 to the Consolidated Financial Statements) - - (20)
Litigation Matters (See Note 24 to the Consolidated Financial Statements) (81) - -
Completion of IRS examination (See Note 20 to the Consolidated Financial Statements) - 24 -
ADJUSTED INCOME FROM OPERATIONS $ 1,734 $ 1,361 $ 1,211
CIGNA CORPORATION - 2012 Form 10-K 35