Cigna 2012 Annual Report Download - page 70
Download and view the complete annual report
Please find page 70 of the 2012 Cigna annual report below. You can navigate through the pages in the report by either clicking on the pages listed below, or by using the keyword search tool below to find specific information within the annual report.-
 1
1 -
2
-
3
-
4
-
5
-
6
-
7
-
8
-
9
-
10
-
11
-
12
-
13
-
14
-
15
-
16
-
17
-
18
-
19
-
20
-
21
-
22
-
23
-
24
-
25
-
26
-
27
-
28
-
29
-
30
-
31
-
32
-
33
-
34
-
35
-
36
-
37
-
38
-
39
-
40
-
41
-
42
-
43
-
44
-
45
-
46
-
47
-
48
-
49
-
50
-
51
-
52
-
53
-
54
-
55
-
56
-
57
-
58
-
59
-
 60
60 -
 61
61 -
 62
62 -
 63
63 -
 64
64 -
 65
65 -
 66
66 -
 67
67 -
 68
68 -
 69
69 -
 70
70 -
 71
71 -
 72
72 -
 73
73 -
 74
74 -
 75
75 -
 76
76 -
 77
77 -
 78
78 -
 79
79 -
 80
80 -
81
-
82
-
83
-
84
-
85
-
86
-
87
-
88
-
89
-
90
-
91
-
92
-
93
-
94
-
95
-
96
-
97
-
98
-
99
-
100
-
101
-
102
-
103
-
104
-
105
-
106
-
107
-
108
-
109
-
110
-
111
-
112
-
113
-
114
-
115
-
116
-
117
-
118
-
119
-
120
-
121
-
122
-
123
-
124
-
125
-
126
-
127
-
128
-
129
-
130
-
131
-
132
-
133
-
134
-
135
-
136
-
137
-
138
-
139
-
140
-
141
-
142
-
143
-
144
-
145
-
146
-
147
-
148
-
149
-
150
-
151
-
152
-
153
-
154
-
155
-
156
-
157
-
158
-
159
-
160
-
161
-
162
-
163
-
164
-
165
-
166
-
167
-
168
-
169
-
170
-
171
-
172
-
173
-
174
-
175
-
176
-
177
-
178
-
179
-
180
-
181
-
182
 |
 |

PART II
ITEM 7 Management’s Discussion and Analysis of Financial Condition and Results of Operations
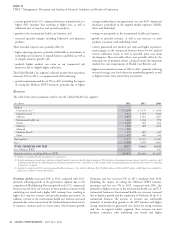
The Company excludes the results of the GMIB business from adjusted income from operations because the fair value of GMIB assets and
liabilities must be recalculated each quarter using updated capital market assumptions. The resulting changes in fair value, that are reported in
shareholders’ net income, can be volatile and unpredictable.
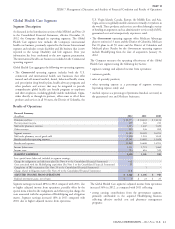
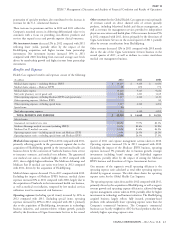
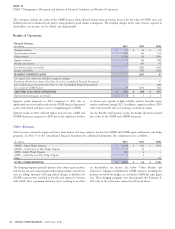
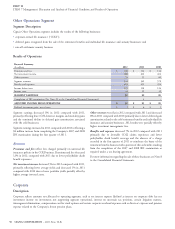
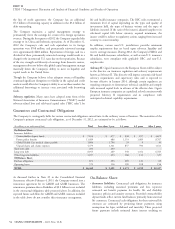
Results of Operations
Financial Summary
(In millions)
2012 2011 2010
Premiums and fees $ 21 $ 24 $ 25
Net investment income 102 103 114
Other revenues (119) (4) (158)
Segment revenues 4 123 (19)
Benefits and expenses 4 405 91
Loss before income tax benefits - (282) (110)
Income tax benefits - (99) (136)
SEGMENT EARNINGS (LOSS) - (183) 26
Less: special items (after-tax) included in segment earnings:
Resolution of federal tax matters (See Note 20 to the Consolidated Financial Statements) - - 97
Loss on Reinsurance transaction (See Note 3 to the Consolidated Financial Statements) - - (20)
Less: results of GMIB business 29 (135) (24)
ADJUSTED LOSS FROM OPERATIONS $ (29) $ (48) $ (27)
Realized investment gains, net of taxes $ 1 $ 4 $ 5
Segment results improved in 2012 compared to 2011 due to in interest rates, periods of high volatility, and less favorable equity
significantly more favorable results for the GMIB business (presented market conditions during 2011. In addition, segment results in 2010
in the table above) and lower reserve strengthening for GMDB. reflect the favorable effect of resolving a federal tax matter.
Segment results in 2011 reflected higher losses for the GMIB and See the Benefits and Expenses section for further discussion around
GMDB businesses compared to 2010 due to the significant declines the results of the GMIB and GMDB businesses.
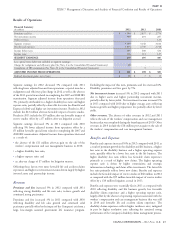
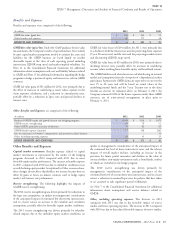
Other Revenues
Other revenues consisted of gains and losses from futures and swap contracts used in the GMDB and GMIB equity and interest rate hedge
programs. See Note 13 to the Consolidated Financial Statements for additional information. The components were as follows:
(In millions)
2012 2011 2010
GMDB – Equity Hedge Program $ (110) $ (45) $ (157)
GMDB – Growth Interest Rate Hedge Program 5 31 -
GMIB – Equity Hedge Program (16) 4 -
GMIB – Growth Interest Rate Hedge Program 2 6 -
Other - - (1)
TOTAL OTHER REVENUES $ (119) $ (4) $ (158)
The hedging programs generally produce losses when equity markets on shareholders’ net income (see below ‘‘Other Benefits and
and interest rates are rising and gains when equity markets and interest Expenses’’). Changes in liabilities for GMIB contracts, including the
rates are falling. Amounts reflecting related changes in liabilities for portion covered by the hedges, are recorded in GMIB fair value (gain)
GMDB contracts were included in benefits and expenses consistent loss. These hedging programs were discontinued after February 4,
with GAAP when a premium deficiency exists, resulting in no effect 2013 due to the reinsurance transaction discussed above.
48 CIGNA CORPORATION - 2012 Form 10-K