Cigna 2012 Annual Report Download - page 66
Download and view the complete annual report
Please find page 66 of the 2012 Cigna annual report below. You can navigate through the pages in the report by either clicking on the pages listed below, or by using the keyword search tool below to find specific information within the annual report.-
 1
1 -
2
-
3
-
4
-
5
-
6
-
7
-
8
-
9
-
10
-
11
-
12
-
13
-
14
-
15
-
16
-
17
-
18
-
19
-
20
-
21
-
22
-
23
-
24
-
25
-
26
-
27
-
28
-
29
-
30
-
31
-
32
-
33
-
34
-
35
-
36
-
37
-
38
-
39
-
40
-
41
-
42
-
43
-
44
-
45
-
46
-
47
-
48
-
49
-
50
-
51
-
52
-
53
-
54
-
55
-
 56
56 -
 57
57 -
 58
58 -
 59
59 -
 60
60 -
 61
61 -
 62
62 -
 63
63 -
 64
64 -
 65
65 -
 66
66 -
 67
67 -
 68
68 -
 69
69 -
 70
70 -
 71
71 -
 72
72 -
 73
73 -
 74
74 -
 75
75 -
 76
76 -
77
-
78
-
79
-
80
-
81
-
82
-
83
-
84
-
85
-
86
-
87
-
88
-
89
-
90
-
91
-
92
-
93
-
94
-
95
-
96
-
97
-
98
-
99
-
100
-
101
-
102
-
103
-
104
-
105
-
106
-
107
-
108
-
109
-
110
-
111
-
112
-
113
-
114
-
115
-
116
-
117
-
118
-
119
-
120
-
121
-
122
-
123
-
124
-
125
-
126
-
127
-
128
-
129
-
130
-
131
-
132
-
133
-
134
-
135
-
136
-
137
-
138
-
139
-
140
-
141
-
142
-
143
-
144
-
145
-
146
-
147
-
148
-
149
-
150
-
151
-
152
-
153
-
154
-
155
-
156
-
157
-
158
-
159
-
160
-
161
-
162
-
163
-
164
-
165
-
166
-
167
-
168
-
169
-
170
-
171
-
172
-
173
-
174
-
175
-
176
-
177
-
178
-
179
-
180
-
181
-
182
 |
 |
PART II
ITEM 7 Management’s Discussion and Analysis of Financial Condition and Results of Operations
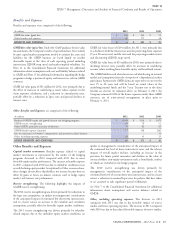
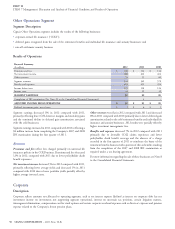
The operating expense ratio increased from 2010 to 2011 primarily driven by a change in business mix resulting from the Company’s decision to
exit the non-strategic Medicare IPFFS business that was a fully-insured business. Excluding the impact of the Medicare IPFFS business, the
operating expense ratio improved for 2011 compared with 2010 driven largely by continued focus on expense management.
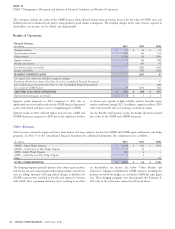
Other Items Affecting Global Health Care Results
Global Health Care Medical Claims Payable
Medical claims payable increased 42% in 2012 compared with 2011, primarily reflecting the acquisition of HealthSpring. Medical claims payable
decreased by 7% in 2011 compared with 2010, primarily reflecting the run-out of the Medicare IPFFS business that the Company exited in 2011.
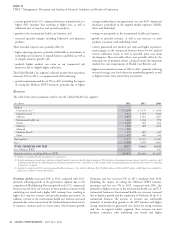
Medical Customers
A medical customer is defined as a person meeting any one of the following criteria:
is covered under an insurance policy or service agreement issued by the Company;
has access to the Company’s provider network for covered services under their medical plan; or
has medical claims that are administered by the Company.
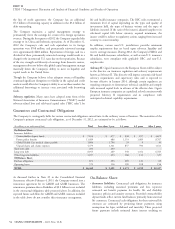
As of December 31, estimated medical customers were as follows:
(In thousands)
2012 2011 2010
Commercial Risk:
U.S. Guaranteed cost
(1)
1,135 1,091 1,177
U.S. Experience-rated
(2)
786 798 849
International health care – Risk 744 582 480
Total commercial risk 2,665 2,471 2,506
Medicare 426 44 145
Medicaid 23 - -
Total government 449 44 145
Total risk 3,114 2,515 2,651
Service, including international health care 10,931 10,165 9,822
TOTAL MEDICAL CUSTOMERS 14,045 12,680 12,473
(1) Excludes customers from the international health care business.
(2) Includes minimum premium customers, who have a risk profile similar to experience-rated members. Also, includes certain non-participating cases for which special customer level reporting
of experience is required. Excludes international health care business.
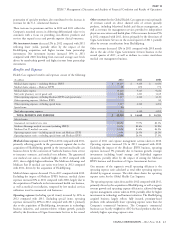
The Company’s overall medical customer base as of December 31, 2012 increased 11% when compared with December 31, 2011, primarily
reflecting ASO customer growth driven by strong retention and sales in targeted market segments, increases in the government segment, primarily
reflecting the impact of the acquisition of HealthSpring as well as growth in the international health care business. The increase in the
international health care risk customers in 2012 also reflects the conversion of the Vanbreda business from service to insurance contracts. The
Global Health Care segment’s overall medical customers as of December 31, 2011 increased 2% when compared with December 31, 2010,
primarily reflecting new business sales and growth in ASO in the targeted Middle and Select market segments, growth in the Individual market
segment that is sold under the guaranteed cost funding arrangement, as well as growth in the international health care business.
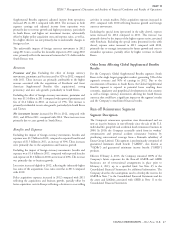
Medicare Advantage Reimbursement Rates for 2014
On February 15, 2013, CMS issued its Advance Notice of Methodological Changes for Calendar Year (CY) 2014 for Medicare Advantage (MA)
Capitation Rates, Part C and Part D Payment Policies (the ‘‘Notice’’). CMS is accepting comments on the Notice, and final terms are expected to
be published on April 1, 2013. While management believes that a significant number of comments from interested parties (including Cigna) will
be provided to CMS, there can be no assurance that CMS will amend its current position. Given the uncertainty regarding the final terms of the
Notice, the Company cannot estimate the impact that it will have on its business, revenues or results of operations but recognizes that any impacts
could be materially adverse. Accordingly, the Company is currently evaluating the potential implications of the Notice, including adjustments
that the Company may make to the programs and services it offers to offset any adverse impacts.
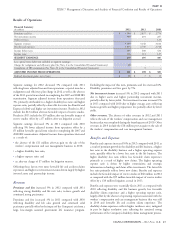
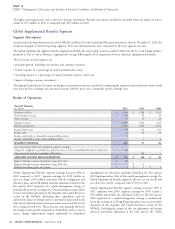
Group Disability and Life Segment
Segment Description
As explained in the Introduction section of this MD&A and in Note 23 to the Consolidated Financial Statements, effective December 31, 2012,
the Company changed its external reporting segments. The Group Disability and Life segment includes group disability, life, accident and
specialty insurance, including certain disability and life insurance business previously reported in the former Health Care segment. Prior year
information has been conformed to the new segment structure.
Key factors for this segment are:
premium growth, including new business and customer retention;
net investment income;
benefits expense as a percentage of earned premium (loss ratio); and
other operating expense as a percentage of earned premiums and fees (expense ratio).
44 CIGNA CORPORATION - 2012 Form 10-K
•
•
•
•
•
•
•