Cigna 2012 Annual Report Download - page 121
Download and view the complete annual report
Please find page 121 of the 2012 Cigna annual report below. You can navigate through the pages in the report by either clicking on the pages listed below, or by using the keyword search tool below to find specific information within the annual report.-
 1
1 -
2
-
3
-
4
-
5
-
6
-
7
-
8
-
9
-
10
-
11
-
12
-
13
-
14
-
15
-
16
-
17
-
18
-
19
-
20
-
21
-
22
-
23
-
24
-
25
-
26
-
27
-
28
-
29
-
30
-
31
-
32
-
33
-
34
-
35
-
36
-
37
-
38
-
39
-
40
-
41
-
42
-
43
-
44
-
45
-
46
-
47
-
48
-
49
-
50
-
51
-
52
-
53
-
54
-
55
-
56
-
57
-
58
-
59
-
60
-
61
-
62
-
63
-
64
-
65
-
66
-
67
-
68
-
69
-
70
-
71
-
72
-
73
-
74
-
75
-
76
-
77
-
78
-
79
-
80
-
81
-
82
-
83
-
84
-
85
-
86
-
87
-
88
-
89
-
90
-
91
-
92
-
93
-
94
-
95
-
96
-
97
-
98
-
99
-
100
-
101
-
102
-
103
-
104
-
105
-
106
-
107
-
108
-
109
-
110
-
 111
111 -
 112
112 -
 113
113 -
 114
114 -
 115
115 -
 116
116 -
 117
117 -
 118
118 -
 119
119 -
 120
120 -
 121
121 -
 122
122 -
 123
123 -
 124
124 -
 125
125 -
 126
126 -
 127
127 -
 128
128 -
 129
129 -
 130
130 -
 131
131 -
132
-
133
-
134
-
135
-
136
-
137
-
138
-
139
-
140
-
141
-
142
-
143
-
144
-
145
-
146
-
147
-
148
-
149
-
150
-
151
-
152
-
153
-
154
-
155
-
156
-
157
-
158
-
159
-
160
-
161
-
162
-
163
-
164
-
165
-
166
-
167
-
168
-
169
-
170
-
171
-
172
-
173
-
174
-
175
-
176
-
177
-
178
-
179
-
180
-
181
-
182
 |
 |
PART II
ITEM 8 Financial Statements and Supplementary Data
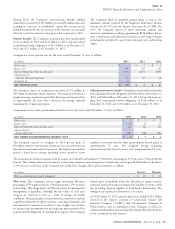
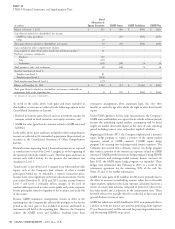
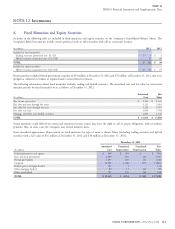
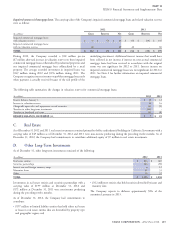
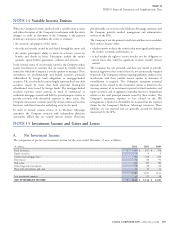
Separate account assets
Fair values and changes in the fair values of separate account assets generally accrue directly to the policyholders and are excluded from the
Company’s revenues and expenses. At December 31, separate account assets were as follows:
Quoted Prices in Significant
Active Markets for Significant Other Unobservable
Identical Assets Observable Inputs Inputs
2012
(In millions)
(Level 1) (Level 2) (Level 3) Total
Guaranteed separate accounts (See Note 24) $ 245 $ 324 $ - $ 569
Non-guaranteed separate accounts
(1)
1,925 4,258 1,005 7,188
TOTAL SEPARATE ACCOUNT ASSETS $ 2,170 $ 4,582 $ 1,005 $ 7,757
(1) As of December 31, 2012, non-guaranteed separate accounts included $3.4 billion in assets supporting the Company’s pension plans, including $956 million classified in Level 3.
Quoted Prices in Significant
Active Markets for Significant Other Unobservable
Identical Assets Observable Inputs Inputs
2011
(In millions)
(Level 1) (Level 2) (Level 3) Total
Guaranteed separate accounts (See Note 24) $ 249 $ 1,439 $ - $ 1,688
Non-guaranteed separate accounts
(1)
1,804 3,851 750 6,405
TOTAL SEPARATE ACCOUNT ASSETS $ 2,053 $ 5,290 $ 750 $ 8,093
(1) As of December 31, 2011, non-guaranteed separate accounts included $3.0 billion in assets supporting the Company’s pension plans, including $702 million classified in Level 3.
Separate account assets in Level 1 include exchange-listed equity actively-traded institutional and retail mutual fund investments and
securities. Level 2 assets primarily include: separate accounts priced using the daily net asset value that is the
exit price.
corporate and structured bonds valued using recent trades of similar
securities or pricing models that discount future cash flows at Separate account assets classified in Level 3 include investments
estimated market interest rates as described above; and primarily in securities partnerships, real estate and hedge funds
generally valued based on the separate account’s ownership share of
the equity of the investee including changes in the fair values of its
underlying investments.
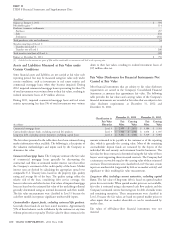
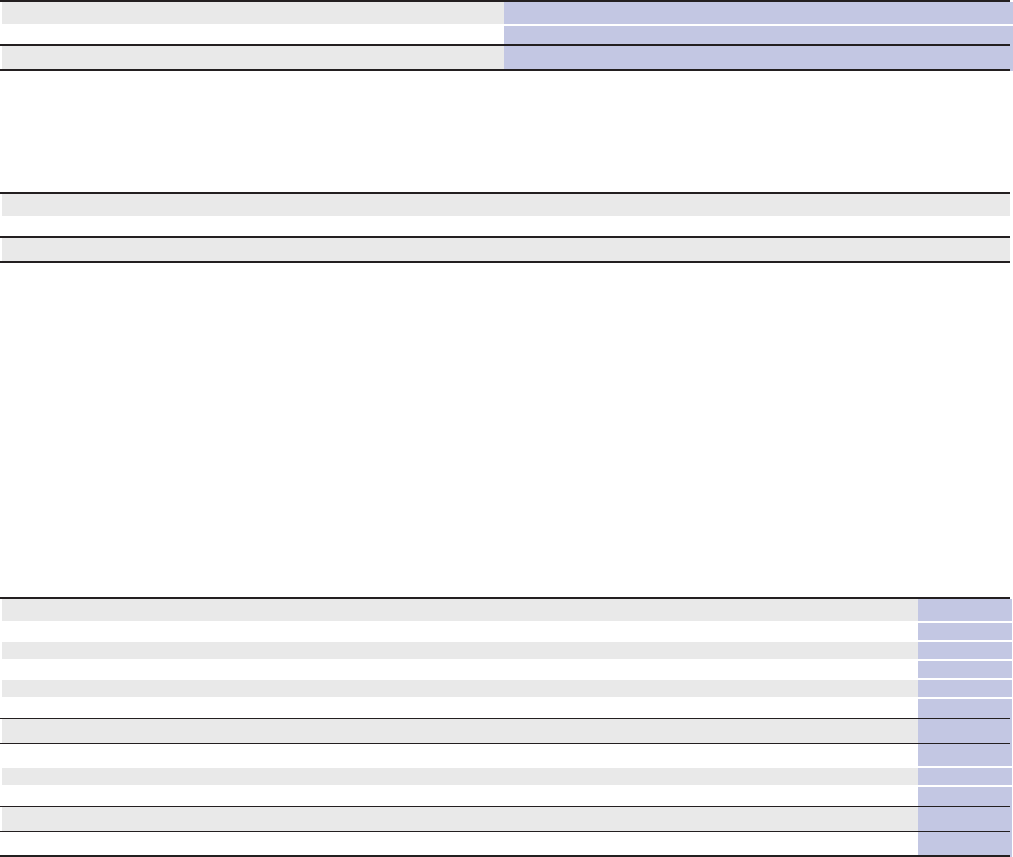
The following tables summarize the change in separate account assets reported in Level 3 for the years ended December 31, 2012 and 2011.
(In millions)
Balance at January 1, 2012 $ 750
Policyholder gains
(1)
55
Purchases, issuances, settlements:
Purchases 283
Sales (6)
Settlements (90)
Total purchases, sales and settlements 187
Transfers into/(out of ) Level 3:
Transfers into Level 3 17
Transfers out of Level 3 (4)
Total transfers into/(out of ) Level 3: 13
Balance at December 31, 2012 $ 1,005
(1) Included in this amount are gains of $49 million attributable to instruments still held at the reporting date.
CIGNA CORPORATION - 2012 Form 10-K 99
•
•