Cigna 2012 Annual Report Download - page 71
Download and view the complete annual report
Please find page 71 of the 2012 Cigna annual report below. You can navigate through the pages in the report by either clicking on the pages listed below, or by using the keyword search tool below to find specific information within the annual report.-
 1
1 -
2
-
3
-
4
-
5
-
6
-
7
-
8
-
9
-
10
-
11
-
12
-
13
-
14
-
15
-
16
-
17
-
18
-
19
-
20
-
21
-
22
-
23
-
24
-
25
-
26
-
27
-
28
-
29
-
30
-
31
-
32
-
33
-
34
-
35
-
36
-
37
-
38
-
39
-
40
-
41
-
42
-
43
-
44
-
45
-
46
-
47
-
48
-
49
-
50
-
51
-
52
-
53
-
54
-
55
-
56
-
57
-
58
-
59
-
60
-
 61
61 -
 62
62 -
 63
63 -
 64
64 -
 65
65 -
 66
66 -
 67
67 -
 68
68 -
 69
69 -
 70
70 -
 71
71 -
 72
72 -
 73
73 -
 74
74 -
 75
75 -
 76
76 -
 77
77 -
 78
78 -
 79
79 -
 80
80 -
 81
81 -
82
-
83
-
84
-
85
-
86
-
87
-
88
-
89
-
90
-
91
-
92
-
93
-
94
-
95
-
96
-
97
-
98
-
99
-
100
-
101
-
102
-
103
-
104
-
105
-
106
-
107
-
108
-
109
-
110
-
111
-
112
-
113
-
114
-
115
-
116
-
117
-
118
-
119
-
120
-
121
-
122
-
123
-
124
-
125
-
126
-
127
-
128
-
129
-
130
-
131
-
132
-
133
-
134
-
135
-
136
-
137
-
138
-
139
-
140
-
141
-
142
-
143
-
144
-
145
-
146
-
147
-
148
-
149
-
150
-
151
-
152
-
153
-
154
-
155
-
156
-
157
-
158
-
159
-
160
-
161
-
162
-
163
-
164
-
165
-
166
-
167
-
168
-
169
-
170
-
171
-
172
-
173
-
174
-
175
-
176
-
177
-
178
-
179
-
180
-
181
-
182
 |
 |

PART II
ITEM 7 Management’s Discussion and Analysis of Financial Condition and Results of Operations
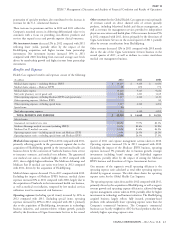
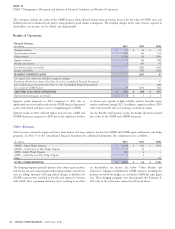
Benefits and Expenses
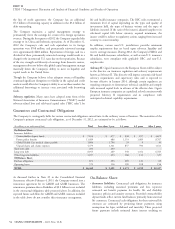
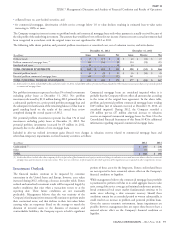
Benefits and expenses were comprised of the following:
(In millions)
2012 2011 2010
GMIB fair value (gain) loss $ (41) $ 234 $ 55
Other benefits and expenses 45 171 36
BENEFITS AND EXPENSES $ 4 $ 405 $ 91
GMIB fair value (gain) loss. Under the GAAP guidance for fair value GMIB fair value losses of $234 million for 2011, were primarily due
to a decline in both the interest rate used for projecting claim exposure
measurements, the Company’s results of operations have been volatile
(7-year Treasury rates) and the rate used for projecting market returns
because capital market assumptions needed to estimate the assets and
and discounting (LIBOR swap curve).
liabilities for the GMIB business are based largely on market
observable inputs at the close of each reporting period including GMIB fair value losses of $55 million for 2010, were primarily due to
interest rates (LIBOR swap curve) and market implied volatilities. See declining interest rates, partially offset by increases in underlying
Note 11 to the Consolidated Financial Statements for additional account values resulting from favorable equity and bond fund returns.
information about assumptions and asset and liability balances related
The GMIB liabilities and related assets are calculated using an internal
to GMIB and Note 13 for additional information regarding the hedge
model and assumptions from the viewpoint of a hypothetical market
programs to hedge a portion of equity and interest rate risks in GMIB participant. Payments for GMIB claims are expected to occur over the
contracts. next 15 to 20 years and will be based on actual values of the
GMIB fair value gains of $41 million for 2012, were primarily due to underlying mutual funds and the 7-year Treasury rate at the dates
the effect of increases in underlying account values, updates in the benefits are elected. As explained above, on February 4, 2013, the
claim exposure calculation, and a reduction in annuitization rates, Company reinsured 100% of the future exposures under these GMIB
partially offset by a reduction in lapse rates and general declines in contracts, net of retrocessional arrangements in place prior to
interest rates. February 4, 2013.
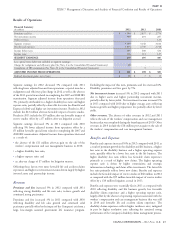
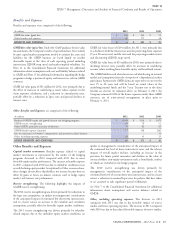
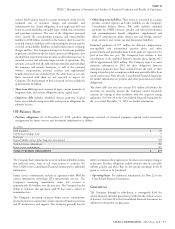
Other Benefits and Expenses are comprised of the following:
(In millions)
2012 2011 2010
Results of GMDB equity and growth interest rate hedging programs $ (105) $ (14) $ (157)
GMDB reserve strengthening 43 70 52
Other GMDB, primarily accretion of discount 79 82 85
GMDB benefit expense (income) 17 138 (20)
Loss on reinsurance of workers’ compensation and personal accident business - - 31
Other, including operating expenses 28 33 25
OTHER BENEFITS AND EXPENSES $ 45 $ 171 $ 36
update to management’s consideration of the anticipated impact of
Other Benefits and Expenses
the continued low level of short-term interest rates, and the adverse
Capital market movements. Benefits expense related to capital impacts of overall market declines, including an increase in the
market movements as represented by the results of the hedging provision for future partial surrenders and declines in the value of
programs decreased in 2012 compared with 2011 due to more contract holders’ non-equity investments such as bond funds, neither
favorable equity market performance. The increase in benefits expense of which are included in the hedge program.
in 2011 compared with 2010 was due to turbulent conditions in an
The 2010 reserve strengthening was driven primarily by
overall declining equity market. As explained in Other revenues above,
management’s consideration of the anticipated impact of the
these changes do not affect shareholders’ net income because they are
continued low level of current short-term interest rates, and to a lesser
offset by gains or losses on futures contracts used to hedge equity
extent, a reduction in assumed lapse rates for policies that have taken
market and interest rate performance.
or are assumed to take significant partial withdrawals.
Reserve strengthening. The following highlights the impacts of
See Note 7 to the Consolidated Financial Statements for additional
GMDB reserve strengthening:
information about assumptions and reserve balances related to
The 2012 reserve strengthening was driven primarily by reductions to GMDB.
the lapse rate assumptions, an update to management’s consideration
of the anticipated impact of continued low short-term interest rates, Other, including operating expenses. The decrease in 2012
and to a lesser extent, an increase to the volatility and correlation compared with 2011 was due to the favorable impact of reserve
assumptions, partially offset by favorable equity market conditions. studies and lower operating expenses. The increase in 2011 compared
with 2010 was due to the reduced favorable impacts of reserve studies.
The 2011 reserve strengthening was driven primarily by volatility-
related impacts due to the turbulent equity market conditions, an
CIGNA CORPORATION - 2012 Form 10-K 49