Cigna 2012 Annual Report Download - page 128
Download and view the complete annual report
Please find page 128 of the 2012 Cigna annual report below. You can navigate through the pages in the report by either clicking on the pages listed below, or by using the keyword search tool below to find specific information within the annual report.-
 1
1 -
2
-
3
-
4
-
5
-
6
-
7
-
8
-
9
-
10
-
11
-
12
-
13
-
14
-
15
-
16
-
17
-
18
-
19
-
20
-
21
-
22
-
23
-
24
-
25
-
26
-
27
-
28
-
29
-
30
-
31
-
32
-
33
-
34
-
35
-
36
-
37
-
38
-
39
-
40
-
41
-
42
-
43
-
44
-
45
-
46
-
47
-
48
-
49
-
50
-
51
-
52
-
53
-
54
-
55
-
56
-
57
-
58
-
59
-
60
-
61
-
62
-
63
-
64
-
65
-
66
-
67
-
68
-
69
-
70
-
71
-
72
-
73
-
74
-
75
-
76
-
77
-
78
-
79
-
80
-
81
-
82
-
83
-
84
-
85
-
86
-
87
-
88
-
89
-
90
-
91
-
92
-
93
-
94
-
95
-
96
-
97
-
98
-
99
-
100
-
101
-
102
-
103
-
104
-
105
-
106
-
107
-
108
-
109
-
110
-
111
-
112
-
113
-
114
-
115
-
116
-
117
-
 118
118 -
 119
119 -
 120
120 -
 121
121 -
 122
122 -
 123
123 -
 124
124 -
 125
125 -
 126
126 -
 127
127 -
 128
128 -
 129
129 -
 130
130 -
 131
131 -
 132
132 -
 133
133 -
 134
134 -
 135
135 -
 136
136 -
 137
137 -
 138
138 -
139
-
140
-
141
-
142
-
143
-
144
-
145
-
146
-
147
-
148
-
149
-
150
-
151
-
152
-
153
-
154
-
155
-
156
-
157
-
158
-
159
-
160
-
161
-
162
-
163
-
164
-
165
-
166
-
167
-
168
-
169
-
170
-
171
-
172
-
173
-
174
-
175
-
176
-
177
-
178
-
179
-
180
-
181
-
182
 |
 |

PART II
ITEM 8 Financial Statements and Supplementary Data
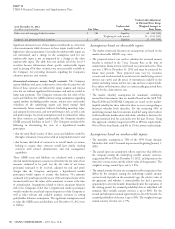
market funds of $40 million. The decrease during 2012 is primarily
E. Short-Term Investments and Cash
due to funds used to acquire HealthSpring. See Note 3 for further
Equivalents
information.
Short-term investments and cash equivalents included corporate
securities of $1.1 billion, federal government securities of
F. Concentration of Risk
$167 million and money market funds of $217 million as of
As of December 31, 2012 and 2011, the Company did not have a
December 31, 2012. The Company’s short-term investments and cash
concentration of investments in a single issuer or borrower exceeding
equivalents as of December 31, 2011 included corporate securities of
10% of shareholders’ equity.
$4.1 billion, federal government securities of $164 million and money
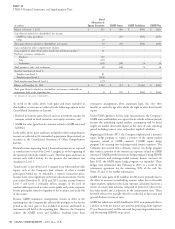
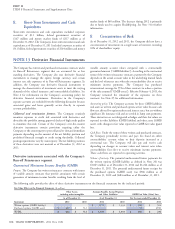
Derivative Financial Instruments
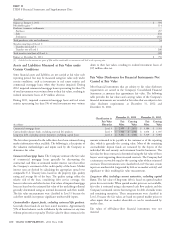
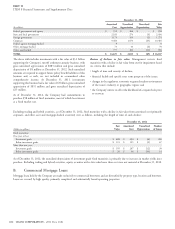
The Company has written and purchased reinsurance contracts under variable annuity account values compared with a contractually
its Run-off Reinsurance segment that are accounted for as free guaranteed amount (‘‘GMIB liabilities’’). According to the contractual
standing derivatives. The Company also uses derivative financial terms of the written reinsurance contracts, payment by the Company
instruments to manage the equity, foreign currency, and certain depends on the actual account value in the underlying mutual funds
interest rate risk exposures of its Run-off Reinsurance segment. In and the level of interest rates when the contractholders elect to receive
addition, the Company uses derivative financial instruments to minimum income payments. The Company has purchased
manage the characteristics of investment assets to meet the varying retrocessional coverage for 55% of these contracts to reduce a portion
demands of the related insurance and contractholder liabilities. See of the risks assumed (‘‘GMIB assets’’). Effective February 4, 2013, the
Note 2 for information on the Company’s accounting policy for Company reinsured the remainder of the exposures on these
derivative financial instruments. Derivatives in the Company’s contracts. See Note 25 for additional information.
separate accounts are excluded from the following discussion because Accounting policy. The Company accounts for these GMIB liabilities
associated gains and losses generally accrue directly to separate and assets as written and purchased options at fair value because cash
account policyholders. flows are affected by equity markets and interest rates, but are without
Collateral and termination features. The Company routinely significant life insurance risk and are settled in lump sum payments.
monitors exposure to credit risk associated with derivatives and These derivatives are not designated as hedges and their fair values are
diversifies the portfolio among approved dealers of high credit quality reported in other liabilities (GMIB liability) and other assets (GMIB
to minimize this risk. Certain of the Company’s over-the-counter asset), with changes in fair value reported in GMIB fair value (gain)
derivative instruments contain provisions requiring either the loss.
Company or the counterparty to post collateral or demand immediate Cash flows. Under the terms of these written and purchased contracts,
payment depending on the amount of the net liability position and the Company periodically receives and pays fees based on either
predefined financial strength or credit rating thresholds. Collateral contractholders’ account values or their deposits increased at a
posting requirements vary by counterparty. The net liability positions contractual rate. The Company will also pay and receive cash
of these derivatives were not material as of December 31, 2012 or depending on changes in account values and interest rates when
2011. contractholders first elect to receive minimum income payments.
These cash flows are reported in operating activities.
Derivative instruments associated with the Company’s
Volume of activity. The potential undiscounted future payments for
Run-off Reinsurance segment.
the written options (GMIB liability, as defined in Note 24) was
$1,065 million as of December 31, 2012 and $1,244 million as of
December 31, 2011. The potential undiscounted future receipts for
Purpose. The Company has written reinsurance contracts with issuers the purchased options (GMIB asset) was $586 million as of
of variable annuity contracts that provide annuitants with certain December 31, 2012 and $684 million as of December 31, 2011.
guarantees of minimum income benefits resulting from the level of
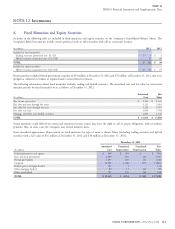
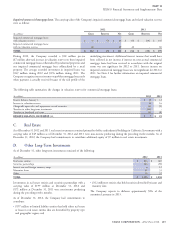
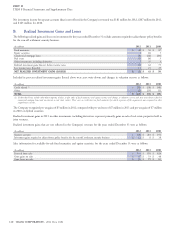
The following table provides the effect of these derivative instruments on the financial statements for the indicated periods:
Fair Value Effect on the Financial Statements
(In millions)
Other Assets, Accounts Payable, Accrued Expenses
including other intangibles and Other Liabilities GMIB Fair Value (Gain) Loss
As of December 31, As of December 31, For the years ended December 31,
Instrument 2012 2011 2012 2011 2012 2011
Written options (GMIB liability) $ 1,170 $ 1,333 $ (96) $ 504
Purchased options (GMIB asset) $ 622 $ 712 55 (270)
TOTAL $ 622 $ 712 $ 1,170 $ 1,333 $ (41) $ 234
106 CIGNA CORPORATION - 2012 Form 10-K
NOTE 13
Guaranteed Minimum Income Benefits (GMIB)