Cigna 2012 Annual Report Download - page 143
Download and view the complete annual report
Please find page 143 of the 2012 Cigna annual report below. You can navigate through the pages in the report by either clicking on the pages listed below, or by using the keyword search tool below to find specific information within the annual report.-
 1
1 -
2
-
3
-
4
-
5
-
6
-
7
-
8
-
9
-
10
-
11
-
12
-
13
-
14
-
15
-
16
-
17
-
18
-
19
-
20
-
21
-
22
-
23
-
24
-
25
-
26
-
27
-
28
-
29
-
30
-
31
-
32
-
33
-
34
-
35
-
36
-
37
-
38
-
39
-
40
-
41
-
42
-
43
-
44
-
45
-
46
-
47
-
48
-
49
-
50
-
51
-
52
-
53
-
54
-
55
-
56
-
57
-
58
-
59
-
60
-
61
-
62
-
63
-
64
-
65
-
66
-
67
-
68
-
69
-
70
-
71
-
72
-
73
-
74
-
75
-
76
-
77
-
78
-
79
-
80
-
81
-
82
-
83
-
84
-
85
-
86
-
87
-
88
-
89
-
90
-
91
-
92
-
93
-
94
-
95
-
96
-
97
-
98
-
99
-
100
-
101
-
102
-
103
-
104
-
105
-
106
-
107
-
108
-
109
-
110
-
111
-
112
-
113
-
114
-
115
-
116
-
117
-
118
-
119
-
120
-
121
-
122
-
123
-
124
-
125
-
126
-
127
-
128
-
129
-
130
-
131
-
132
-
 133
133 -
 134
134 -
 135
135 -
 136
136 -
 137
137 -
 138
138 -
 139
139 -
 140
140 -
 141
141 -
 142
142 -
 143
143 -
 144
144 -
 145
145 -
 146
146 -
 147
147 -
 148
148 -
 149
149 -
 150
150 -
 151
151 -
 152
152 -
 153
153 -
154
-
155
-
156
-
157
-
158
-
159
-
160
-
161
-
162
-
163
-
164
-
165
-
166
-
167
-
168
-
169
-
170
-
171
-
172
-
173
-
174
-
175
-
176
-
177
-
178
-
179
-
180
-
181
-
182
 |
 |

PART II
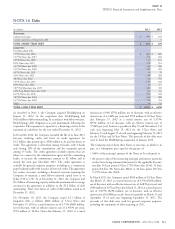
ITEM 8 Financial Statements and Supplementary Data
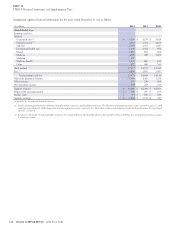
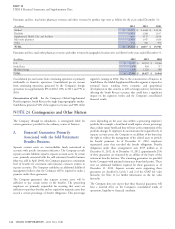
(In millions)
2012 2011 2010
Group Disability and Life
Premiums and fees:
Life $ 1,426 $ 1,333 $ 1,341
Disability 1,413 1,268 1,167
Other 270 256 262
Total 3,109 2,857 2,770
Other revenues - - 123
Net investment income 300 291 287
Segment revenues $ 3,409 $ 3,148 $ 3,180
Depreciation and amortization $10$10$ 8
Income taxes $ 116 $ 113 $ 127
Segment earnings $ 279 $ 295 $ 305
Global Supplemental Benefits
Premiums and fees $ 1,984 $ 1,528 $ 1,231
Other revenues 21 15 22
Net investment income 90 83 69
Segment revenues $ 2,095 $ 1,626 $ 1,322
Depreciation and amortization $28$13$ 8
Income taxes $ 36 $ 36 $ 42
Equity in income of investees $ 10 $ 15 $ 18
Segment earnings $ 142 $ 97 $ 84
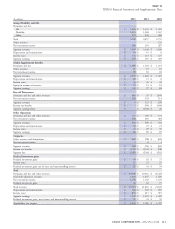
Run-off Reinsurance
Premiums and fees and other revenues $ (98) $ 20 $ (133)
Net investment income 102 103 114
Segment revenues $ 4 $ 123 $ (19)
Income tax benefits $ - $ (99) $ (136)
Segment earnings (loss) $ - $ (183) $ 26
Other Operations
Premiums and fees and other revenues $ 155 $ 169 $ 174
Net investment income 388 400 404
Segment revenues $ 543 $ 569 $ 578
Depreciation and amortization $ 22 $ 25 $ 21
Income taxes $ 43 $ 29 $ 39
Segment earnings $ 82 $ 89 $ 85
Corporate
Other revenues and eliminations $ (61) $ (58) $ (62)
Net investment income 561
Segment revenues $ (56) $ (52) $ (61)
Income tax benefits $ (148) $ (101) $ (98)
Segment loss $ (329) $ (184) $ (211)
Realized investment gains
Realized investment gains $ 44 $ 62 $ 75
Income taxes 13 21 25
Realized investment gains net of taxes and noncontrolling interest $ 31 $ 41 $ 50
Total
Premiums and fees and other revenues $ 26,308 $ 19,210 $ 18,528
Mail order pharmacy revenues 1,623 1,447 1,420
Net investment income 1,144 1,146 1,105
Realized investment gains 44 62 75
Total revenues $ 29,119 $ 21,865 $ 21,128
Depreciation and amortization $ 560 $ 345 $ 292
Income taxes $ 853 $ 615 $ 519
Segment earnings $ 1,592 $ 1,219 $ 1,229
Realized investment gains, net of taxes and noncontrolling interest $ 31 $ 41 $ 50
Shareholders’ net income $ 1,623 $ 1,260 $ 1,279
CIGNA CORPORATION - 2012 Form 10-K 121