Cigna 2012 Annual Report Download - page 126
Download and view the complete annual report
Please find page 126 of the 2012 Cigna annual report below. You can navigate through the pages in the report by either clicking on the pages listed below, or by using the keyword search tool below to find specific information within the annual report.-
 1
1 -
2
-
3
-
4
-
5
-
6
-
7
-
8
-
9
-
10
-
11
-
12
-
13
-
14
-
15
-
16
-
17
-
18
-
19
-
20
-
21
-
22
-
23
-
24
-
25
-
26
-
27
-
28
-
29
-
30
-
31
-
32
-
33
-
34
-
35
-
36
-
37
-
38
-
39
-
40
-
41
-
42
-
43
-
44
-
45
-
46
-
47
-
48
-
49
-
50
-
51
-
52
-
53
-
54
-
55
-
56
-
57
-
58
-
59
-
60
-
61
-
62
-
63
-
64
-
65
-
66
-
67
-
68
-
69
-
70
-
71
-
72
-
73
-
74
-
75
-
76
-
77
-
78
-
79
-
80
-
81
-
82
-
83
-
84
-
85
-
86
-
87
-
88
-
89
-
90
-
91
-
92
-
93
-
94
-
95
-
96
-
97
-
98
-
99
-
100
-
101
-
102
-
103
-
104
-
105
-
106
-
107
-
108
-
109
-
110
-
111
-
112
-
113
-
114
-
115
-
 116
116 -
 117
117 -
 118
118 -
 119
119 -
 120
120 -
 121
121 -
 122
122 -
 123
123 -
 124
124 -
 125
125 -
 126
126 -
 127
127 -
 128
128 -
 129
129 -
 130
130 -
 131
131 -
 132
132 -
 133
133 -
 134
134 -
 135
135 -
 136
136 -
137
-
138
-
139
-
140
-
141
-
142
-
143
-
144
-
145
-
146
-
147
-
148
-
149
-
150
-
151
-
152
-
153
-
154
-
155
-
156
-
157
-
158
-
159
-
160
-
161
-
162
-
163
-
164
-
165
-
166
-
167
-
168
-
169
-
170
-
171
-
172
-
173
-
174
-
175
-
176
-
177
-
178
-
179
-
180
-
181
-
182
 |
 |
PART II
ITEM 8 Financial Statements and Supplementary Data
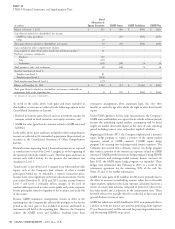
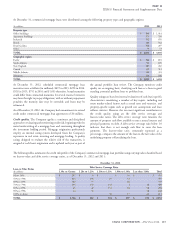
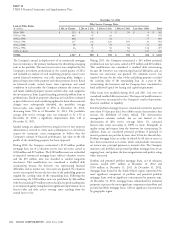
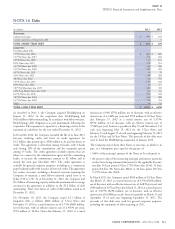
December 31, 2011
Debt Service Coverage Ratio
Loan-to-Value Ratios
(In millions)
1.30x or Greater 1.20x to 1.29x 1.10x to 1.19x 1.00x to 1.09x Less than 1.00x Total
Below 50% $ 225 $ 55 $ 3 $ 50 $ 9 $ 342
50% to 59% 444 47 26 - 53 570
60% to 69% 646 140 42 - 77 905
70% to 79% 117 132 120 159 33 561
80% to 89% 99 81 79 72 71 402
90% to 99% 36 35 30 58 116 275
100% or above - 10 50 51 135 246
TOTAL $ 1,567 $ 500 $ 350 $ 390 $ 494 $ 3,301
The Company’s annual in-depth review of its commercial mortgage During 2011, the Company restructured a $65 million potential
loan investments is the primary mechanism for identifying emerging problem loan into two notes carried at $55 million and $10 million.
risks in the portfolio. The most recent review was completed by the This modification was considered a troubled debt restructuring
Company’s investment professionals in the second quarter of 2012 because the borrower was experiencing financial difficulties and an
and included an analysis of each underlying property’s most recent interest rate concession was granted. No valuation reserve was
annual financial statements, rent rolls, operating plans, budgets, a required because the fair value of the underlying property exceeded
physical inspection of the property and other pertinent factors. Based the carrying value of the outstanding loan. As a part of this
on historical results, current leases, lease expirations and rental restructuring, the borrowers and the Company have committed to
conditions in each market, the Company estimates the current year fund additional capital for leasing and capital requirements.
and future stabilized property income and fair value, and categorizes Other loans were modified during 2012 and 2011, but were not
the investments as loans in good standing, potential problem loans or considered troubled debt restructures. The impact of modifications to
problem loans. Based on property valuations and cash flows estimated these loans was not material to the Company’s results of operations,
as part of this review, and considering updates for loans where material financial condition or liquidity.
changes were subsequently identified, the portfolio’s average
loan-to-value ratio improved to 65% at December 31, 2012, Potential problem mortgage loans are considered current (no payment
decreasing from 70% as of December 31, 2011. The portfolio’s more than 59 days past due), but exhibit certain characteristics that
average debt service coverage ratio was estimated to be 1.56 at increase the likelihood of future default. The characteristics
December 31, 2012, a significant improvement from 1.40 at management considers include, but are not limited to, the
December 31, 2011. deterioration of debt service coverage below 1.0, estimated
loan-to-value ratios increasing to 100% or more, downgrade in
Quality ratings are adjusted between annual reviews if new property quality rating and request from the borrower for restructuring. In
information is received or events such as delinquency or a borrower’s addition, loans are considered potential problems if principal or
request for restructure cause management to believe that the interest payments are past due by more than 30 but less than 60 days.
Company’s estimate of financial performance, fair value or the risk Problem mortgage loans are either in default by 60 days or more or
profile of the underlying property has been impacted. have been restructured as to terms, which could include concessions
During 2012, the Company restructured a $119 million problem on interest rate, principal payment or maturity date. The Company
mortgage loan, net of a valuation reserve, into two notes carried at monitors each problem and potential problem mortgage loan on an
$100 million and $19 million. The $100 million note was reclassified ongoing basis, and updates the loan categorization and quality rating
to impaired commercial mortgage loans with no valuation reserves when warranted.
and the $19 million note was classified as another long-term Problem and potential problem mortgage loans, net of valuation
investment. This modification was considered a troubled debt reserves, totaled $215 million at December 31, 2012 and
restructuring because the borrower was experiencing financial $336 million at December 31, 2011. At December 31, 2012,
difficulties and an interest rate concession was granted. No valuation mortgage loans located in the South Atlantic region represented the
reserve was required because the fair value of the underlying property most significant component of problem and potential problem
equaled the carrying value of the outstanding loan. Following the mortgage loans, with no significant concentration by property type.
restructuring, the $100 million note was paid down by $46 million At December 31, 2011, mortgage loans collateralized by industrial
with the remaining $54 million note reclassified to good standing due properties represent the most significant component of problem and
to an improved quality rating based on significant improvements in its potential problem mortgage loans, with no significant concentration
loan-to-value and debt service coverage ratios resulting from the by geographic region.
annual loan review.
104 CIGNA CORPORATION - 2012 Form 10-K