Cigna 2012 Annual Report Download - page 58
Download and view the complete annual report
Please find page 58 of the 2012 Cigna annual report below. You can navigate through the pages in the report by either clicking on the pages listed below, or by using the keyword search tool below to find specific information within the annual report.-
 1
1 -
2
-
3
-
4
-
5
-
6
-
7
-
8
-
9
-
10
-
11
-
12
-
13
-
14
-
15
-
16
-
17
-
18
-
19
-
20
-
21
-
22
-
23
-
24
-
25
-
26
-
27
-
28
-
29
-
30
-
31
-
32
-
33
-
34
-
35
-
36
-
37
-
38
-
39
-
40
-
41
-
42
-
43
-
44
-
45
-
46
-
47
-
 48
48 -
 49
49 -
 50
50 -
 51
51 -
 52
52 -
 53
53 -
 54
54 -
 55
55 -
 56
56 -
 57
57 -
 58
58 -
 59
59 -
 60
60 -
 61
61 -
 62
62 -
 63
63 -
 64
64 -
 65
65 -
 66
66 -
 67
67 -
 68
68 -
69
-
70
-
71
-
72
-
73
-
74
-
75
-
76
-
77
-
78
-
79
-
80
-
81
-
82
-
83
-
84
-
85
-
86
-
87
-
88
-
89
-
90
-
91
-
92
-
93
-
94
-
95
-
96
-
97
-
98
-
99
-
100
-
101
-
102
-
103
-
104
-
105
-
106
-
107
-
108
-
109
-
110
-
111
-
112
-
113
-
114
-
115
-
116
-
117
-
118
-
119
-
120
-
121
-
122
-
123
-
124
-
125
-
126
-
127
-
128
-
129
-
130
-
131
-
132
-
133
-
134
-
135
-
136
-
137
-
138
-
139
-
140
-
141
-
142
-
143
-
144
-
145
-
146
-
147
-
148
-
149
-
150
-
151
-
152
-
153
-
154
-
155
-
156
-
157
-
158
-
159
-
160
-
161
-
162
-
163
-
164
-
165
-
166
-
167
-
168
-
169
-
170
-
171
-
172
-
173
-
174
-
175
-
176
-
177
-
178
-
179
-
180
-
181
-
182
 |
 |
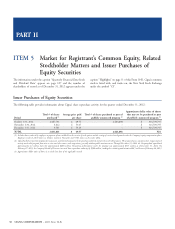
PART II
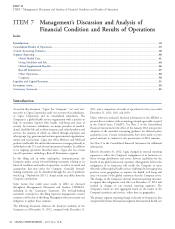
ITEM 7 Management’s Discussion and Analysis of Financial Condition and Results of Operations
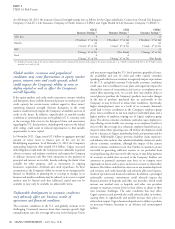
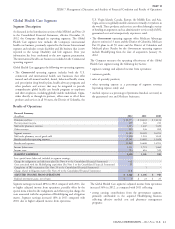
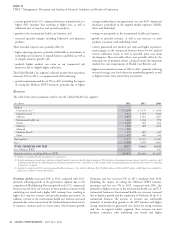
Summarized below is adjusted income from operations by segment and other key consolidated financial data:
Adjusted Income (Loss) From Operations
(In millions)
2012 2011 2010
Global Health Care $ 1,480 $ 1,104 $ 940
Group Disability and Life 281 290 305
Global Supplemental Benefits 148 100 84
Run-off Reinsurance (29) (48) (27)
Other Operations 82 85 85
Corporate (228) (170) (176)
TOTAL $ 1,734 $ 1,361 $ 1,211
Other Key Consolidated Financial Data
Global medical customers (in thousands) 14,045 12,680 12,473
Cash flows from operating activities $ 2,350 $ 1,491 $ 1,743
Shareholders’ equity $ 9,769 $ 7,994 $ 6,356
Shareholders’ net income decreased 1% in 2011 compared with
Consolidated Results of Operations – 2012
2010, due to significantly higher GMIB losses principally reflecting
Compared to 2011
lower interest rates, substantially offset by higher adjusted income
from operations.
Revenues increased 33% in 2012, primarily reflecting contributions
from HealthSpring as well as higher revenues in each of the Adjusted income from operations increased 12% in 2011
Company’s ongoing businesses from continued growth in the compared with 2010 primarily due to higher earnings contributions
Company’s targeted global market segments. See further detailed from the Company’s Global Health Care and Global Supplemental
discussion of revenues below and segment revenues in the individual Benefits segments. These results reflect solid business growth in
segment discussions of this MD&A. strategically targeted markets and continued low medical services
utilization trend.
Shareholders’ net income increased 29% in 2012, primarily
resulting from substantially higher adjusted income from operations Global medical customers increased 2%, reflecting growth in
as discussed below and significantly improved GMIB results due to targeted markets, primarily the middle and select market segments
more favorable market conditions in 2012. See the Run-off domestically as well as growth in the international health care
Reinsurance section of this MD&A for additional information on business. These increases were partially offset by exits from certain
GMIB results. These favorable effects were partially offset by the non-strategic markets, primarily Medicare IPFFS.
2012 special items for litigation and the realignment and efficiency
plan.
Liquidity and Financial Condition
Adjusted income from operations increased 27% in 2012, largely
During 2012, the following items affected the Company’s liquidity
attributable to earnings contributions from HealthSpring, as well as
and financial condition:
overall revenue growth in the other ongoing operating segments and
lower charges related to the GMDB business. See the individual Cash flows from operating activities. For 2012, cash flows from
segment sections of this MD&A for further discussion. operating activities were higher than 2011 primarily attributable to
strong earnings and business growth in the Company’s ongoing
Global medical customers increased 11% primarily attributable to
operating segments.
growth in strategically targeted global markets reflecting solid
customer persistency and strong new sales as well as the acquisition Acquisitions. During 2012, the Company acquired HealthSpring,
of HealthSpring. Great American Supplemental Benefits and Finans Emeklilik for a
combined purchase price of approximately $4.2 billion. See Note 3
to the Consolidated Financial Statement for additional information.
Consolidated Results of Operations – 2011
Repayment of Debt. During the first quarter of 2012, the
Compared to 2010
Company repaid the acquired HealthSpring debt of $326 million.
Revenues rose 3% in 2011 compared with 2010, reflecting solid See Note 16 to the Consolidated Financial Statements for additional
growth in the Company’s strategically targeted domestic and information.
international customer segments of its ongoing global health care, Pension Plan Contributions. During 2012, the Company
global supplemental benefits, and group disability and life contributed $250 million to the Company’s domestic qualified
businesses. In addition, the increase in revenue reflects the effect of pension plans; See Note 10 to the Consolidated Financial
the programs to hedge equity and growth interest rate exposures in Statements for additional information; and
the run-off reinsurance operations. See the Run-off Reinsurance
section of this MD&A beginning on page 47 for additional Share Repurchase. The Company repurchased 4.4 million shares
information. These increases were partially offset by the exit from of stock for $208 million. See the Liquidity and Capital Resources
certain non-strategic markets, primarily the Medicare Advantage section of this MD&A for additional information.
Individual Private Fee For Service (‘‘Medicare IPFFS’’) business.
36 CIGNA CORPORATION - 2012 Form 10-K
•
•
•
•
•
•
•
•
•
•
•
•
•