CarMax 2003 Annual Report Download - page 6
Download and view the complete annual report
Please find page 6 of the 2003 CarMax annual report below. You can navigate through the pages in the report by either clicking on the pages listed below, or by using the keyword search tool below to find specific information within the annual report.-
 1
1 -
 2
2 -
 3
3 -
 4
4 -
 5
5 -
 6
6 -
 7
7 -
 8
8 -
 9
9 -
 10
10 -
 11
11 -
 12
12 -
 13
13 -
 14
14 -
 15
15 -
 16
16 -
 17
17 -
18
-
19
-
20
-
21
-
22
-
23
-
24
-
25
-
26
-
27
-
28
-
29
-
30
-
31
-
32
-
33
-
34
-
35
-
36
-
37
-
38
-
39
-
40
-
41
-
42
-
43
-
44
-
45
-
46
-
47
-
48
-
49
-
50
-
51
-
52
 |
 |
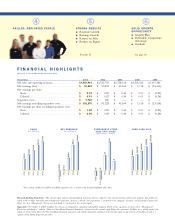
4CARMAX 2003
Home
Improve-
ment
1- to 6-
Year-Old
Used
Cars
U.S.
Retail
Used-Car
Market
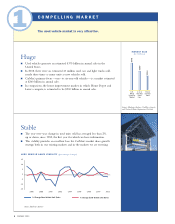
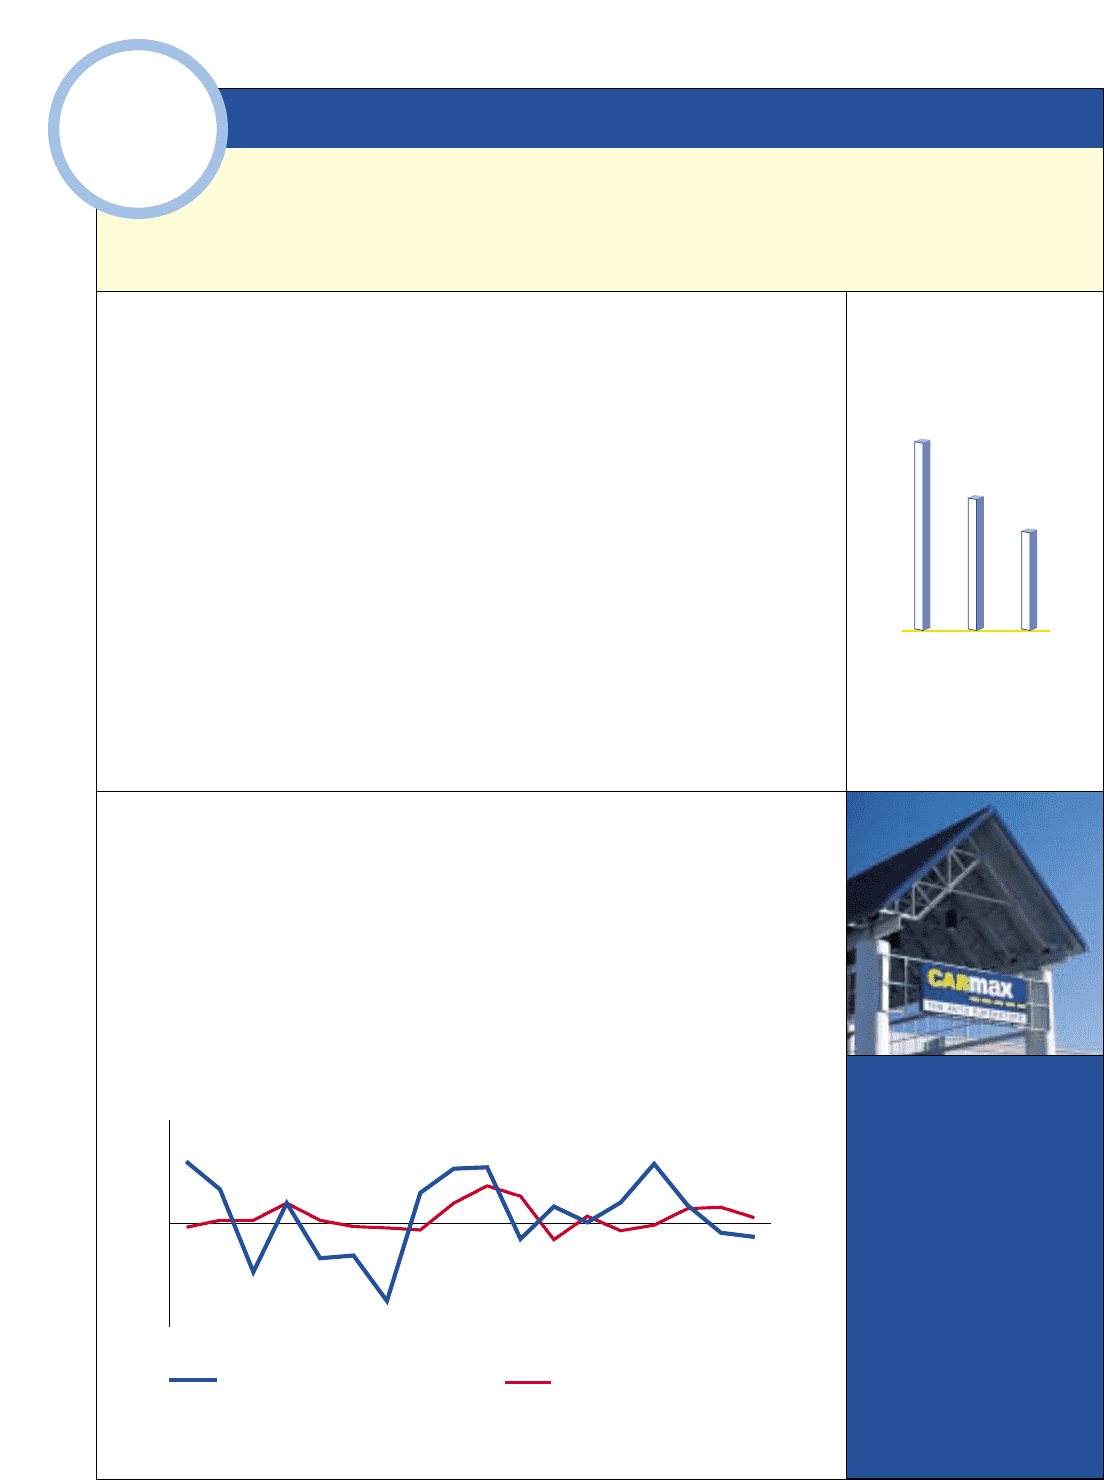
$375
$260
$200
MARKET SIZE
(in billions)
USED VEHICLE SALES STABILITY (percentage change)
Source: Manheim Auctions, CarMax estimates
and National Home Improvement Institute
Source: Manheim Auctions
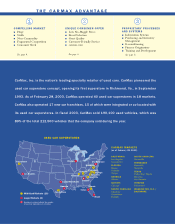
1COMPELLING MARKET
The used vehicle market is very attractive.
Huge
■Used vehicles generate an estimated $375 billion in annual sales in the
United States.
■In 2002, there were an estimated 43 million used cars and light trucks sold,
nearly three times as many units as new vehicles sold.
■CarMax’s primary focus—one- to six-year-old vehicles— is a market estimated
at $260 billion in annual sales.
■In comparison, the home improvement market, in which Home Depot and
Lowe’s compete, is estimated to be $200 billion in annual sales.
Stable
■The year-over-year change in used units sold has averaged less than 2%,
up or down, since 1985, the first year for which we have information.
■This stability provides an excellent base for CarMax’s market share growth
strategy, both in our existing markets and in the markets we are entering.
-15
-10
-5
0
5
10
15
% Change Used Vehicle Unit Sales
% Change New Vehicle Unit Sales
200220001998199619941992199019881986