CarMax 2003 Annual Report Download - page 3
Download and view the complete annual report
Please find page 3 of the 2003 CarMax annual report below. You can navigate through the pages in the report by either clicking on the pages listed below, or by using the keyword search tool below to find specific information within the annual report.-
 1
1 -
 2
2 -
 3
3 -
 4
4 -
 5
5 -
 6
6 -
 7
7 -
 8
8 -
 9
9 -
 10
10 -
 11
11 -
 12
12 -
 13
13 -
 14
14 -
15
-
16
-
17
-
18
-
19
-
20
-
21
-
22
-
23
-
24
-
25
-
26
-
27
-
28
-
29
-
30
-
31
-
32
-
33
-
34
-
35
-
36
-
37
-
38
-
39
-
40
-
41
-
42
-
43
-
44
-
45
-
46
-
47
-
48
-
49
-
50
-
51
-
52
 |
 |
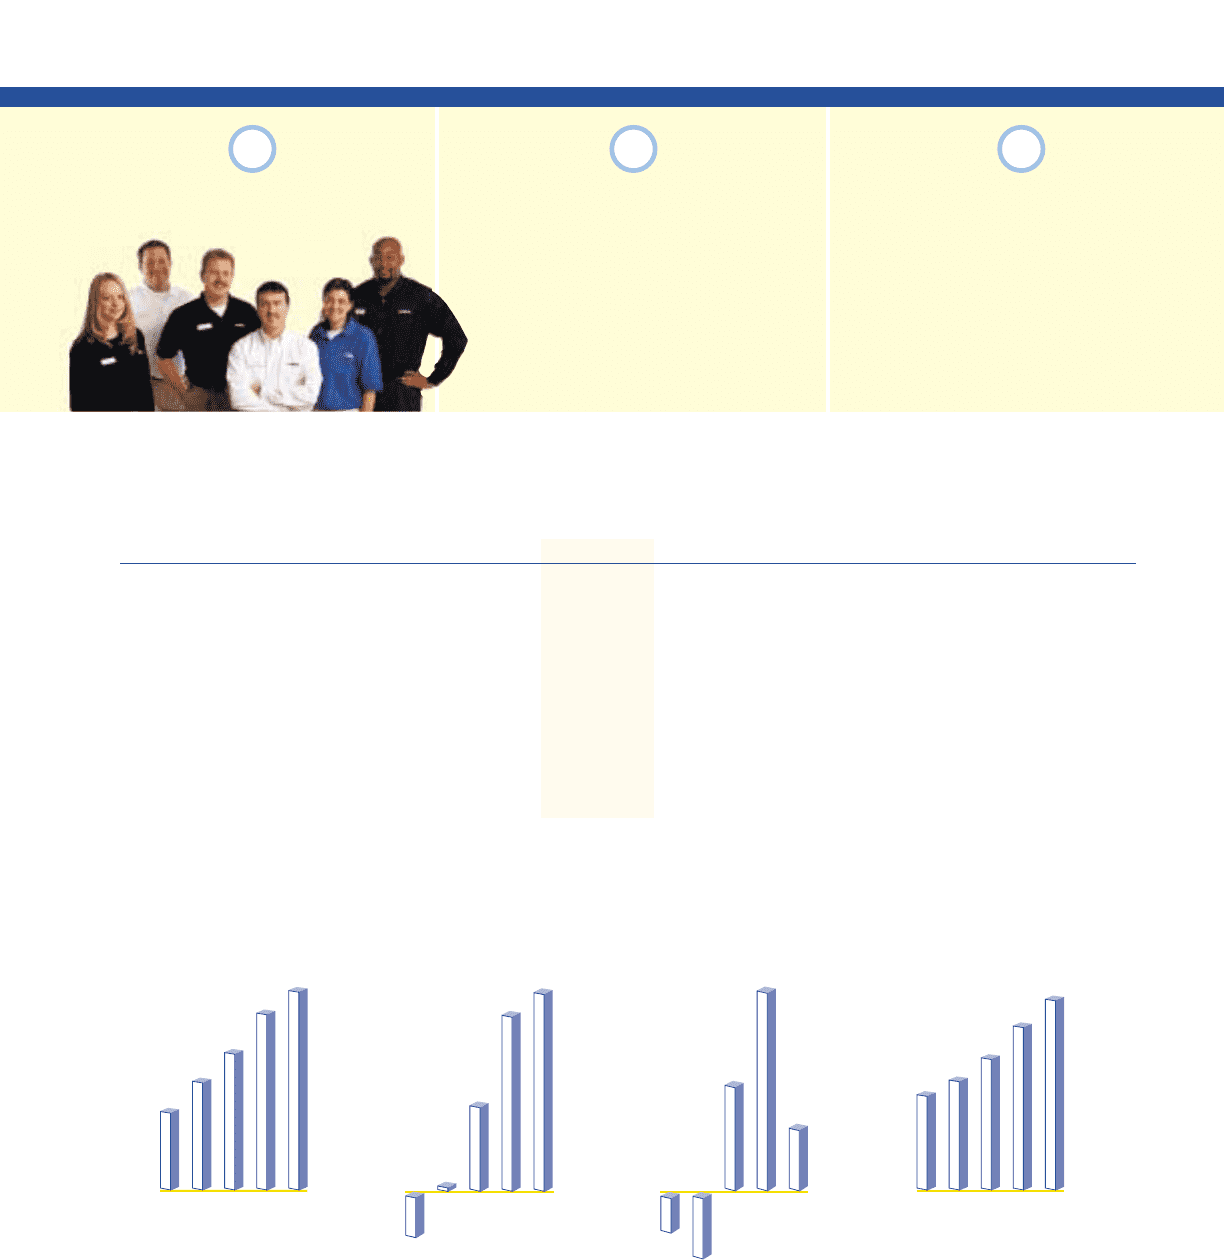
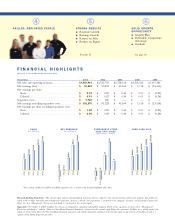
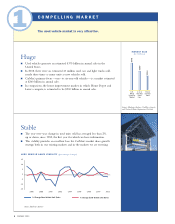
Fiscal Years 2003 2002 2001 2000 1999
Net sales and operating revenues. . . . . . . . . . . . . . . $3,969,944 $3,533,759 $2,758,512 $2,201,232 $1,607,283
Net earnings (loss). . . . . . . . . . . . . . . . . . . . . . . . . $ 94,802 $ 90,802 $ 45,564 $ 1,118 $ (23,514)
Net earnings per share:
Basic. . . . . . . . . . . . . . . . . . . . . . . . . . . . . . . . $ 0.92 $ 0.89 $ 0.45 $ 0.01 $ (0.24)
Diluted . . . . . . . . . . . . . . . . . . . . . . . . . . . . . . $ 0.91 $ 0.87 $ 0.44 $ 0.01 $ (0.24)
Separation costs . . . . . . . . . . . . . . . . . . . . . . . . . . $ 7,768 $426$—$—$—
Net earnings excluding separation costs . . . . . . . . . . $ 102,570 $ 91,228 $ 45,564 $ 1,118 $ (23,514)
Net earnings per share excluding separation costs:
Basic. . . . . . . . . . . . . . . . . . . . . . . . . . . . . . . . $ 1.00 $ 0.89 $ 0.45 $ 0.01 $ (0.24)
Diluted . . . . . . . . . . . . . . . . . . . . . . . . . . . . . . $ 0.98 $ 0.88 $ 0.44 $ 0.01 $ (0.24)
SALES
(in billions) NET EARNINGS*
(in millions) USED CARS SOLD
COMPARABLE STORE
USED UNIT SALES
(percentage change)
FINANCIAL HIGHLIGHTS
(Amounts in thousands except per share data)
STRONG RESULTS
■Revenue Growth
■Earnings Growth
■Return on Sales
■Return on Equity
See page 12.
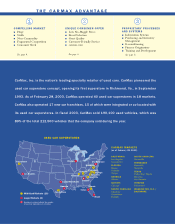
SOLID GROWTH
OPPORTUNITY
■Growth Plan
■Defensible Competitive
Advantage
■Outlook
See page 14.
456
Forward-Looking Statements: This annual report contains forward-looking statements that are subject to risks and uncertainties. Discussion of factors that could cause
actual results to differ materially from management’s projections, forecasts, estimates and expectations is contained in the company’s Securities and Exchange Commission
filings. See also “Management’s Discussion and Analysis” contained in this annual report.
Separation: On October 1, 2002, CarMax, Inc. became an independent, separately traded public company. Details of the separation are discussed in “Management’s
Discussion and Analysis” and the “Notes to Consolidated Financial Statements” contained in this annual report. Before the separation, CarMax was a wholly owned sub-
sidiary of Circuit City Stores, Inc.The consolidated financial statements and related information contained in this annual report are presented as if CarMax existed as a
separate entity during all periods presented.
FY03
FY02
FY01
FY00
FY99
96,900
111,200
132,900
164,000
190,100
FY03
FY02
FY01
FY00
FY99
$(23.5)
$1.1
$45.6
$91.2
$102.6
FY03
FY02
FY01
FY00
FY99
$1.61
$2.20
$2.76
$3.53
$3.97
FY03
FY02
FY01
FY00
FY99
(5)
(8)
13
24
8
*Net earnings exclude fiscal 2003 and 2002 separation costs as shown in the financial highlights table above.
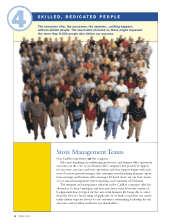
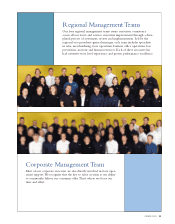
SKILLED, DEDICATED PEOPLE
See page 10.