CarMax 2003 Annual Report Download - page 22
Download and view the complete annual report
Please find page 22 of the 2003 CarMax annual report below. You can navigate through the pages in the report by either clicking on the pages listed below, or by using the keyword search tool below to find specific information within the annual report.-
 1
1 -
2
-
3
-
4
-
5
-
6
-
7
-
8
-
9
-
10
-
11
-
 12
12 -
 13
13 -
 14
14 -
 15
15 -
 16
16 -
 17
17 -
 18
18 -
 19
19 -
 20
20 -
 21
21 -
 22
22 -
 23
23 -
 24
24 -
 25
25 -
 26
26 -
 27
27 -
 28
28 -
 29
29 -
 30
30 -
 31
31 -
 32
32 -
33
-
34
-
35
-
36
-
37
-
38
-
39
-
40
-
41
-
42
-
43
-
44
-
45
-
46
-
47
-
48
-
49
-
50
-
51
-
52
 |
 |

20 CARMAX 2003
CarMax provides financing for prime-rated customers
through CAF, its finance operation, and through third-
party lenders, one that provides financing to prime-rated
customers and three that provide financing to non-prime-
rated customers. Offering customers a third-party
alternative for prime loans enhances the CarMax consumer
offer and helps to ensure that CAF remains competitive.
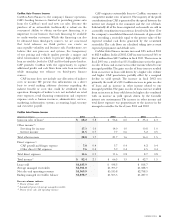
Third-party finance fees are fees received from third-party
lenders who finance CarMax customers’ automobile loans.
Third-party finance fees were $16.2 million in fiscal 2003,
$15.7 million in fiscal 2002 and $11.5 million in fiscal
2001. The increase in fiscal 2003 was the result of the
increase in used car sales, partially offset by the decline in
new car sales and CAF’s capturing of prime customer
market share from the third-party prime lender. The
increase in fiscal 2002 was the result of the increase in retail
sales, especially new car sales.
Impact of Inflation. Inflation has not been a significant
contributor to results. Profitability is based on achieving
specific gross profit dollars per vehicle rather than on
average retail prices. Because the wholesale market for late-
model used cars adjusts to reflect retail price trends, we
believe that if the stores meet inventory turn objectives,
then changes in average retail prices will have only a short-
term impact on the gross margin and thus profitability.
Retail Stores. During fiscal 2003, we opened two
standard-sized used car superstores and three prototype
satellite superstores. We also integrated one of our stand-
alone DaimlerChrysler franchises with a standard-sized used
car superstore and sold a co-located Nissan franchise.
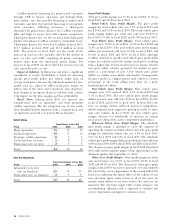
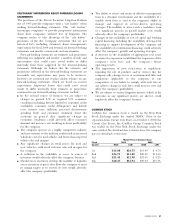
Retail Stores
Retail Stores at Year End
Fiscal 2003 2002 2001
Mega superstores 13 13 13
Standard superstores 19 17 16
Prototype satellite superstores 854
Co-located new car stores 222
Stand-alone new car stores 235
Total 44 40 40
New Car Franchises
New Car Franchises at Year End
Fiscal 2003 2002 2001
Integrated/co-located
new car franchises 15 15 17
Stand-alone new car franchises 235
Total 17 18 22
Gross Profit Margin
Total gross profit margin was 11.8% in fiscal 2003, 11.9% in
fiscal 2002 and 12.4% in fiscal 2001.
Retail Vehicle Gross Profit Margin. The gross profit
margin for retail vehicle sales was 9.7% in fiscal 2003 and
fiscal 2002 and 10.2% in fiscal 2001.The retail vehicle gross
profit margin dollars per retail unit sold were $1,570 in
fiscal 2003, $1,580 in fiscal 2002 and $1,590 in fiscal 2001.
Used Vehicle Gross Profit Margin. Used vehicle gross
margins were 10.8% in fiscal 2003, 10.9% in fiscal 2002 and
11.4% in fiscal 2001. The used vehicle gross profit margin
dollars per used unit sold were $1,650 in fiscal 2003 and
$1,660 in fiscal 2002 and 2001. In fiscal 2002, although
CarMax achieved its specific used vehicle gross profit dollar
targets per vehicle, increased average retail prices resulting
from a higher mix of later-model used cars, luxury vehicles
and sport utility vehicles generated the decline in gross
profit as a percentage of sales. Used vehicle gross profit
dollars are similar across makes and models. Consequently,
the gross profit on a higher-priced used vehicle is a lower
percentage of the retail selling price than on a more
modestly priced vehicle.
New Vehicle Gross Profit Margin. New vehicle gross
margins were 4.0% in fiscal 2003, 4.5% in fiscal 2002 and
5.1% in fiscal 2001. The new vehicle gross profit margin
dollars per new unit sold were $930 in fiscal 2003, $1,050
in fiscal 2002 and $1,160 in fiscal 2001. In fiscal 2003, the
new car margin decline reflected increased competition,
which required more aggressive pricing in order to drive
unit sales volume. In fiscal 2002, the new vehicle gross
margin decrease was attributable to increases in average
retail prices along with a more competitive marketplace.
Wholesale Vehicle Gross Profit Margin. The wholesale
gross profit margin is intended to cover the expenses of
operating the auctions and their related costs.The gross profit
margin for wholesale vehicle sales was 5.5% in fiscal 2003,
5.6% in fiscal 2002 and 6.5% in fiscal 2001. The wholesale
vehicle gross profit margin dollars per wholesale unit sold were
$190 in fiscal 2003, $200 in fiscal 2002 and $220 in fiscal 2001.
The decrease in gross profit margin in fiscal 2002 from fiscal
2001 reflected the negative impact of the rapid decline in the
wholesale market after September 11, 2001.
Other Gross Profit Margin. Gross profit margin for other
sales and revenues was 66.5% in fiscal 2003, 68.3% in fiscal
2002 and 68.0% in 2001. The decrease in other gross profit
margin in fiscal 2003 was due to increased costs and relatively
flat sales for the service department in the second half of the
fiscal year, reflecting the initial effect of the rollout of our
new electronic repair order system to all of our stores. In
months when rollouts occur, store service sales and costs are
impacted. The electronic repair order system enhances our
reconditioning efficiency and is expected to enhance the
service department and improve customer service.