CarMax 2003 Annual Report Download - page 21
Download and view the complete annual report
Please find page 21 of the 2003 CarMax annual report below. You can navigate through the pages in the report by either clicking on the pages listed below, or by using the keyword search tool below to find specific information within the annual report.-
 1
1 -
2
-
3
-
4
-
5
-
6
-
7
-
8
-
9
-
10
-
 11
11 -
 12
12 -
 13
13 -
 14
14 -
 15
15 -
 16
16 -
 17
17 -
 18
18 -
 19
19 -
 20
20 -
 21
21 -
 22
22 -
 23
23 -
 24
24 -
 25
25 -
 26
26 -
 27
27 -
 28
28 -
 29
29 -
 30
30 -
 31
31 -
32
-
33
-
34
-
35
-
36
-
37
-
38
-
39
-
40
-
41
-
42
-
43
-
44
-
45
-
46
-
47
-
48
-
49
-
50
-
51
-
52
 |
 |
CARMAX 2003 19
to sales growth in fiscal 2002.The growth in total comparable
store vehicle units reflects increased store traffic that, combined
with better in-store execution, resulted in comparable store
unit sales growth for both used and new cars. We believe that
the higher traffic levels were driven by the effectiveness of our
marketing programs, carmax.com and word-of-mouth
customer referrals. In addition, traffic was bolstered in October,
November and December by cross-shopping from zero-
percent financing incentive programs introduced by new car
manufacturers to counteract an industry-wide slowdown in
new car sales. Increased used car average retail prices resulting
from a higher mix of later-model used cars, luxury vehicles and
sport utility vehicles and higher new car average retail prices
also contributed to the sales growth.
A CarMax store is included in comparable store retail sales
after the store has been open for a full year (in the store’s
fourteenth full month of operation).
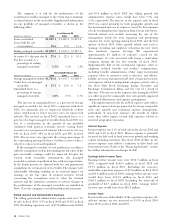
Comparable Store Retail Vehicle Sales Change
Fiscal 2003 2002 2001
Vehicle units:
Used vehicles 8% 24% 13%
New vehicles (3)% 21% 9%
Total 6% 23% 12%
Vehicle dollars:
Used vehicles 8% 30% 19%
New vehicles (3)% 24% 9%
Total 6% 28% 17%
Percent Retail Vehicle Sales
Fiscal 2003 2002 2001
Vehicle units:
Used vehicles 89 % 87% 87%
New vehicles 11 13 13
Total 100 % 100% 100%
Vehicle dollars:
Used vehicles 85 % 82% 81%
New vehicles 15 18 19
Total 100 % 100% 100%
Retail Unit Sales
Fiscal 2003 2002 2001
Used vehicles 190,100 164,000 132,900
New vehicles 22,400 24,200 20,100
Total 212,500 188,200 153,000
Average Retail Selling Prices
Fiscal 2003 2002 2001
Used vehicles $15,200 $15,100 $14,400
New vehicles $23,200 $23,100 $22,600
Total vehicles $16,100 $16,200 $15,500
Wholesale Vehicle Sales. CarMax’s operating strategy is
to build customer confidence and satisfaction by offering
high-quality vehicles; therefore, fewer than half of the
vehicles acquired from consumers through the appraisal
purchase process meet our standards for reconditioning and
subsequent retail sale. Those vehicles that do not meet our
standards are sold at our on-site wholesale auctions. Total
wholesale vehicle units sold at these auctions were 104,600
in fiscal 2003; 90,900 in fiscal 2002; and 73,300 in fiscal
2001.Wholesale vehicle sales totaled $366.6 million in fiscal
2003, $325.6 million in fiscal 2002 and $253.5 million in
fiscal 2001. The increase in fiscal 2003 resulted from an
increase in the rate of acceptance of our vehicle appraisal
offer.The impact of this increase was partially offset by lower
average wholesale prices.The increase in fiscal 2002 resulted
from an increase in the number of appraisals performed
while the rate of customer acceptance of the appraisal offer
remained consistent with fiscal 2001.
Other Sales and Revenues. Other sales and revenues
include extended warranty revenues, service department sales,
appraisal purchase processing fees collected from customers
for the purchase of their vehicles and third-party finance fees.
These totaled $171.4 million in fiscal 2003, $151.1 million in
fiscal 2002 and $119.7 million in fiscal 2001.
CarMax sells extended warranties on behalf of unrelated
third parties who are the primary obligors. Under these third-
party warranty programs, the company has no contractual
liability to the customer. Extended warranty revenue
represents commissions from the unrelated third parties and
was $68.1 million in fiscal 2003, $55.3 million in fiscal 2002
and $45.0 million in fiscal 2001. These increases in warranty
revenue reflect improved penetration, a result in part of the
continuing enhancement of the extended warranty offer, and
strong sales growth for used cars, which achieve a higher
extended warranty penetration rate than new cars.
Service department sales were $58.6 million in fiscal 2003,
$55.9 million in fiscal 2002 and $44.8 million in fiscal 2001.
The increase in service department sales for fiscal 2003 reflects
the continued overall increase in CarMax’s customer base,
offset modestly by the initial effect of a rollout of the new
electronic repair order system to our stores. As each store
implemented the new electronic repair order system, service
department sales were impacted based on the time required
for the training of service managers and technicians. The
increase in fiscal 2002 relates to an overall increase in
CarMax’s customer base.
Appraisal purchase processing fees were $28.5 million in
fiscal 2003, $24.2 million in fiscal 2002 and $18.5 million in
fiscal 2001. Appraisal purchase processing fees collected from
customers are designed to cover some of the costs of our
appraisal and wholesale operations.The increase in fiscal 2003
resulted from the increased consumer response to the vehicle
appraisal offer. The increase in fiscal 2002 was the result of
increased traffic, increased consumer response to the vehicle
appraisal offer and an increase in the fee amount.