CarMax 2003 Annual Report Download - page 42
Download and view the complete annual report
Please find page 42 of the 2003 CarMax annual report below. You can navigate through the pages in the report by either clicking on the pages listed below, or by using the keyword search tool below to find specific information within the annual report.-
 1
1 -
2
-
3
-
4
-
5
-
6
-
7
-
8
-
9
-
10
-
11
-
12
-
13
-
14
-
15
-
16
-
17
-
18
-
19
-
20
-
21
-
22
-
23
-
24
-
25
-
26
-
27
-
28
-
29
-
30
-
31
-
 32
32 -
 33
33 -
 34
34 -
 35
35 -
 36
36 -
 37
37 -
 38
38 -
 39
39 -
 40
40 -
 41
41 -
 42
42 -
 43
43 -
 44
44 -
 45
45 -
 46
46 -
 47
47 -
 48
48 -
 49
49 -
 50
50 -
 51
51 -
 52
52
 |
 |
40 CARMAX 2003
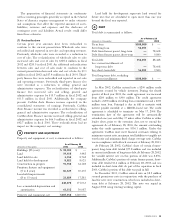
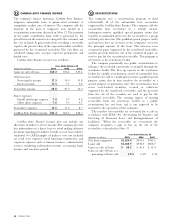
CARMAX AUTO FINANCE INCOME
The company’s finance operation, CarMax Auto Finance,
originates automobile loans to prime-rated customers at
competitive market rates of interest. The company sells the
majority of the loans it originates each month in a
securitization transaction discussed in Note 12. The majority
of the profit contribution from CAF is generated by the
spread between the interest rate charged to the customer and
the cost of funds. A gain results from recording a receivable
equal to the present value of the expected residual cash flows
generated by the securitized receivables. The cash flows are
calculated taking into account expected prepayment and
default rates.
CarMax Auto Finance income was as follows:
Years Ended February 28
(Amounts in millions) 2003 2002 2001
Gains on sales of loans $68.2 $56.4 $35.4
Other income:
Servicing fee income 17.3 14.0 10.8
Interest income 11.5 7.7 5.2
Total other income 28.8 21.7 16.0
Direct expenses:
Payroll and fringes expense 7.0 5.7 4.2
Other direct expenses 7.6 5.9 4.5
Total direct expenses 14.6 11.6 8.7
CarMax Auto Finance income $82.4 $66.5 $42.7
CarMax Auto Finance income does not include any
allocation of indirect costs or income.The company presents
this information on a direct basis to avoid making arbitrary
decisions regarding the indirect benefit or costs that could be
attributed to CAF. Examples of indirect costs not included
are retail store expenses, retail financing commissions and
corporate expenses such as human resources, administrative
services, marketing, information systems, accounting, legal,
treasury and executive payroll.
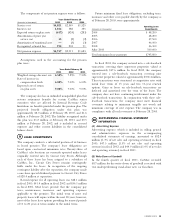
SECURITIZATIONS
The company uses a securitization program to fund
substantially all of the automobile loan receivables
originated by CarMax Auto Finance.The company sells the
automobile loan receivables to a wholly owned,
bankruptcy-remote, qualified special purpose entity that
transfers an undivided interest in the receivables to a group
of third-party investors.The qualified special purpose entity
and investors have no recourse to the company’s assets for
the principal amount of the loans. The investors issue
commercial paper supported by the transferred receivables,
and the proceeds from the sale of the commercial paper are
used to pay for the securitized receivables. This program is
referred to as the warehouse facility.
The company periodically uses public securitizations to
refinance the receivables previously securitized through the
warehouse facility. This frees up capacity in the warehouse
facility. In a public securitization, a pool of automobile loan
receivables are sold to a bankruptcy-remote, qualified special
purpose entity that in turn transfers the receivables to a
special purpose securitization trust. The securitization trust
issues asset-backed securities, secured or otherwise
supported by the transferred receivables, and the proceeds
from the sale of the securities are used to pay for the
securitized receivables. The earnings impact of moving
receivables from the warehouse facility to a public
securitization has not been and is not expected to be
material to the operations of the company.
The transfers of receivables are accounted for as sales in
accordance with SFAS 140, “Accounting for Transfers and
Servicing of Financial Assets and Extinguishments of
Liabilities.” When the receivables are securitized, the
company recognizes a gain or loss on the sale of the
receivables as described in Note 11.
Years Ended February 28
(Amounts in millions) 2003 2002 2001
Net loans originated $1,189.0 $941.0 $785.5
Loans sold $1,185.9 $938.5 $818.7
Gains on sales of loans $ 68.2 $ 56.4 $ 35.4
Gains on sales of loans as a
percentage of loans sold 5.8% 6.0% 4.3%
11 12